Commodity in the balance between China and global tensions
Prices influenced by macro and political news, but movements are increasingly short-term
Published by Luca Sazzini. .
Conjunctural Indicators Commodities Financial WeekWeekly Summary of Commodity Financial Prices
In last week’s article: US-China truce pushes up commodity prices, a general increase in commodity financial prices was highlighted, driven by the new Geneva agreements between the United States and China. These agreements significantly reduced tariffs between the two powers, marking a concrete step toward de-escalating trade tensions.
This week, however, the bullish effect linked to the easing climate has been tempered by new negative macroeconomic data from the Chinese economy and a rekindling of trade tensions. On Monday, Beijing announced the introduction of an anti-dumping duty of up to 75% on imports of certain plastics (acetal resins) from the United States, European Union, Taiwan, and Japan. On Friday, President Donald Trump threatened to impose 50% tariffs on US imports from the European Union starting June 1st, citing a stall in trade negotiations.
The combination of persistent weakness in the Chinese economy and renewed trade tensions exerted downward pressure on financial commodity prices, with the exception of gold, which benefited from a safe-haven rally, also supported by the downgrade of the US sovereign credit rating announced by Moody’s on Monday.
In the oil market, prices declined due to fears of a further increase in supply exceeding demand, driven by:
- a potential increase in OPEC supply: OPEC members are considering a new increase in oil production starting in July. This would signal a shift in the cartel’s strategy from supporting oil prices to defending market share.
- negative macroeconomic data from China: recent economic indicators revealed a marked slowdown in Chinese oil demand following "Liberation Day" and the escalation of US-China trade tensions. Even assuming geopolitical easing, the structural fragility of China’s economy—confirmed by disappointing industrial production and retail sales data—continues to weigh on energy demand prospects in the country.
- an unexpected increase in US oil inventories: EIA’s weekly data showed a higher-than-expected rise in crude reserves, indicating weaker domestic demand and contributing to bearish pressure in the market.
Despite downward pressure on oil prices from oversupply concerns, some upside risks are emerging from geopolitical tensions. In particular, US intelligence sources suggest that Israel may be preparing to strike Iran’s nuclear facilities, raising fears of escalation in the Middle East and potential oil supply disruptions.
Moreover, uncertainty remains over the outcome of the nuclear agreement between the United States and Iran. The US is demanding that Iran suspend uranium enrichment—a process that can be used for both civilian and military purposes—while Iran has stated that the request is non-negotiable.
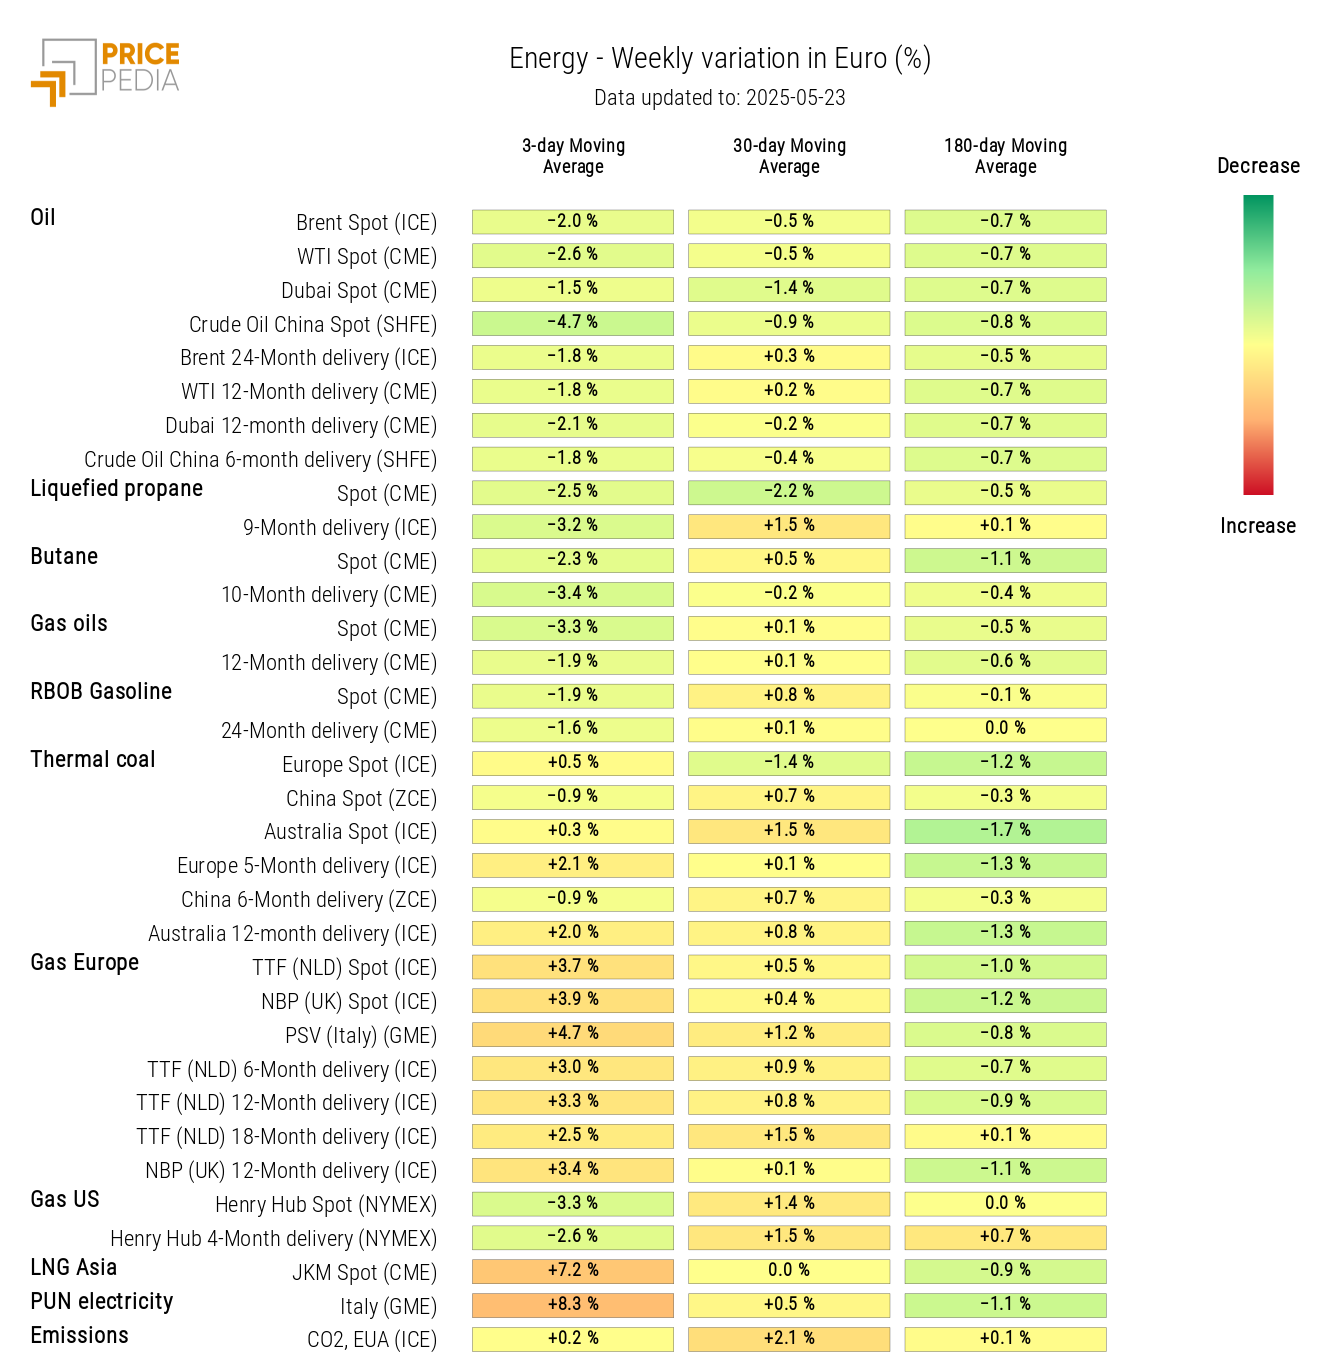
The price of Dutch TTF natural gas rose by 5% on Tuesday, driven by colder weather forecasts and unplanned maintenance at the Kollsnes plant in Norway. However, prices progressively declined over the following days. The sharpest drop occurred midday Friday after Trump’s threat of a 50% tariff on US imports from the EU, followed by a partial recovery in the afternoon.
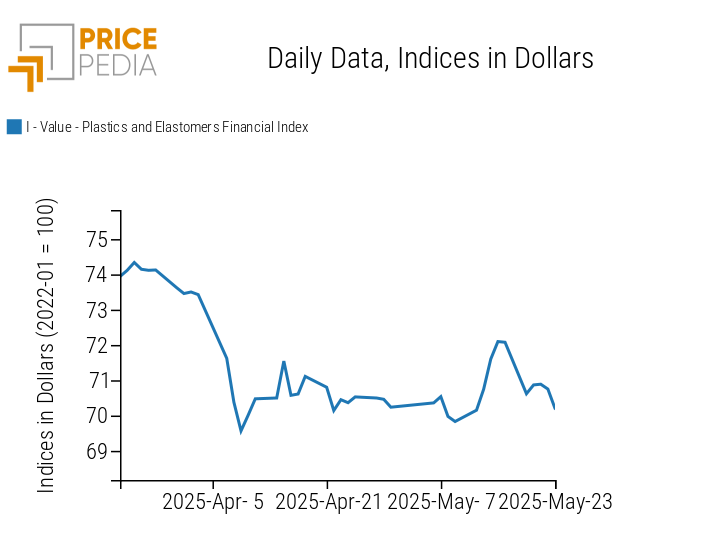
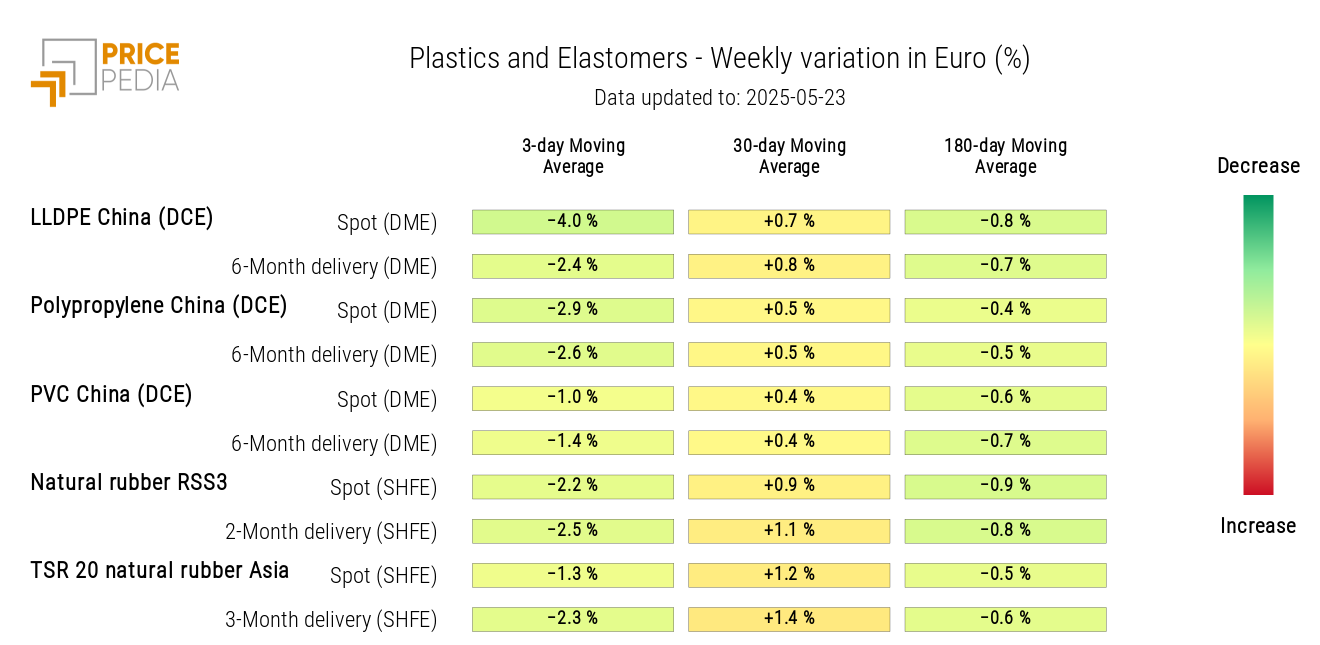
China’s financial markets for plastics and elastomers recorded the sharpest decline, due to the continued weakness of the Chinese economy. The overall index for elastomers and plastics quoted in China fell by nearly 3% on Monday, erasing most of the previous week’s gains.
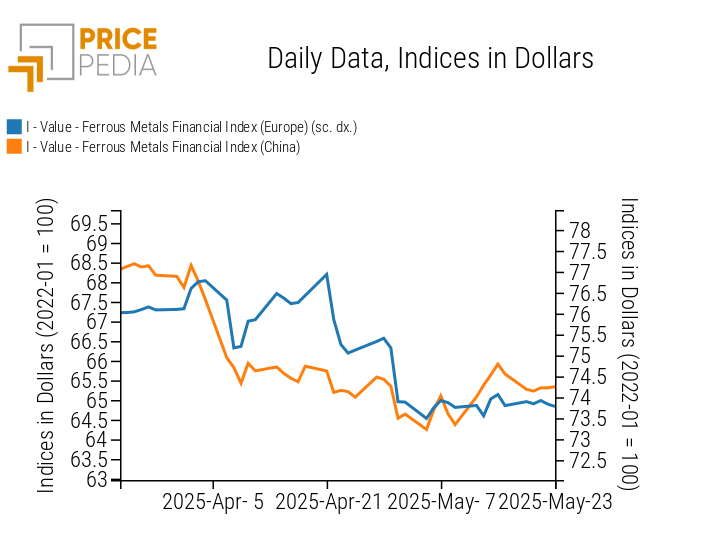
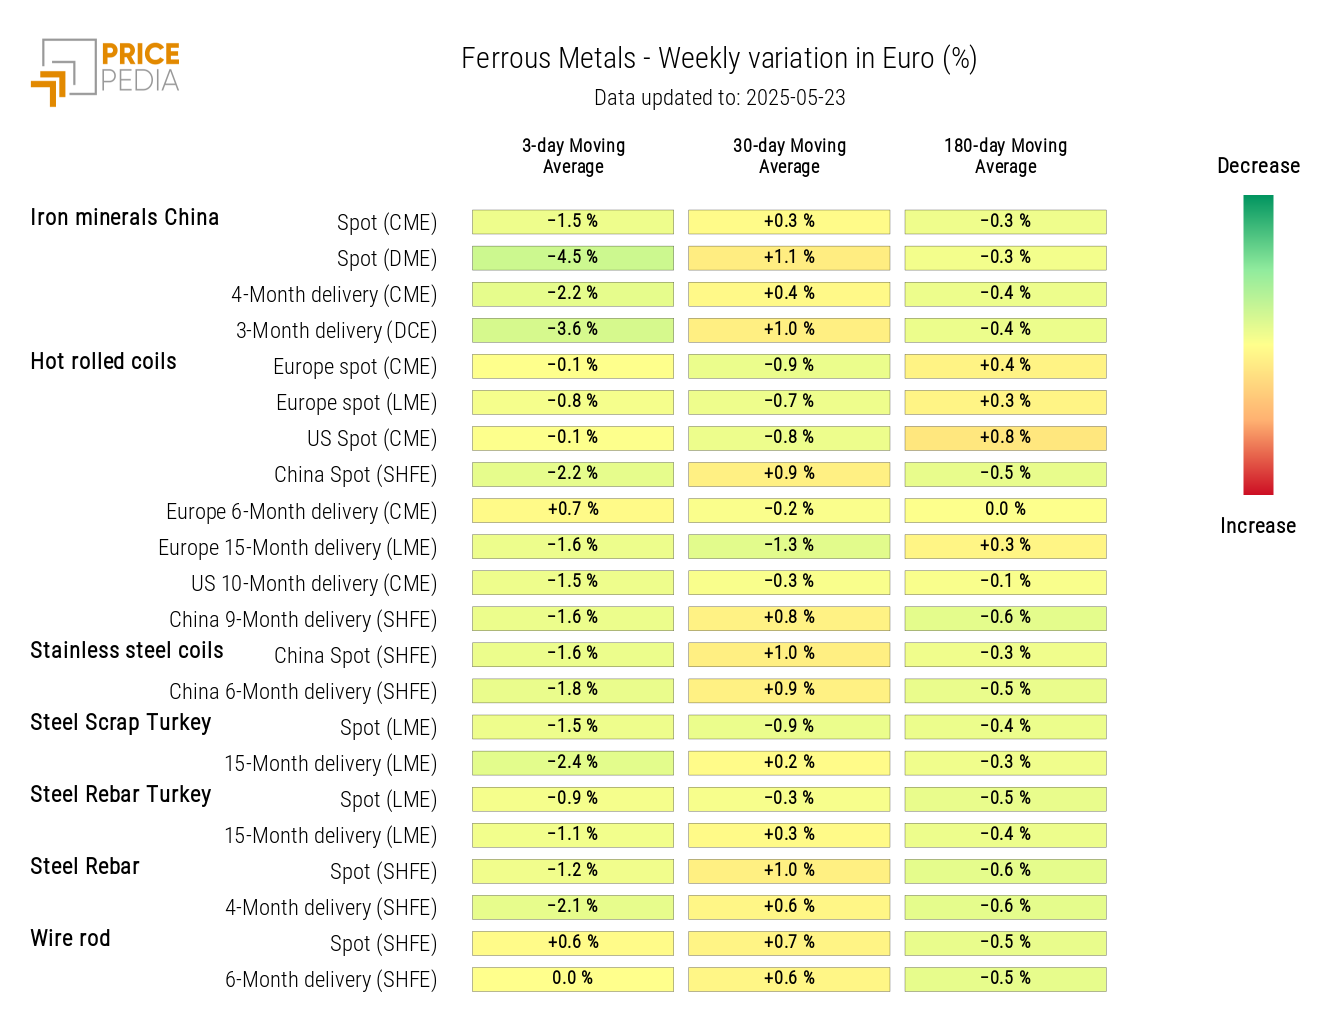
Prices of ferrous metals moved mostly sideways in Europe, while in China, prices declined on Monday, driven by falling iron ore and hot-rolled coil prices.
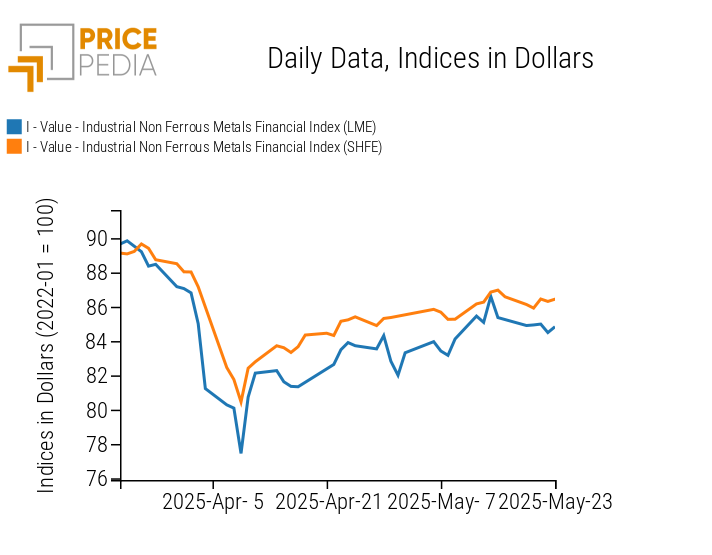
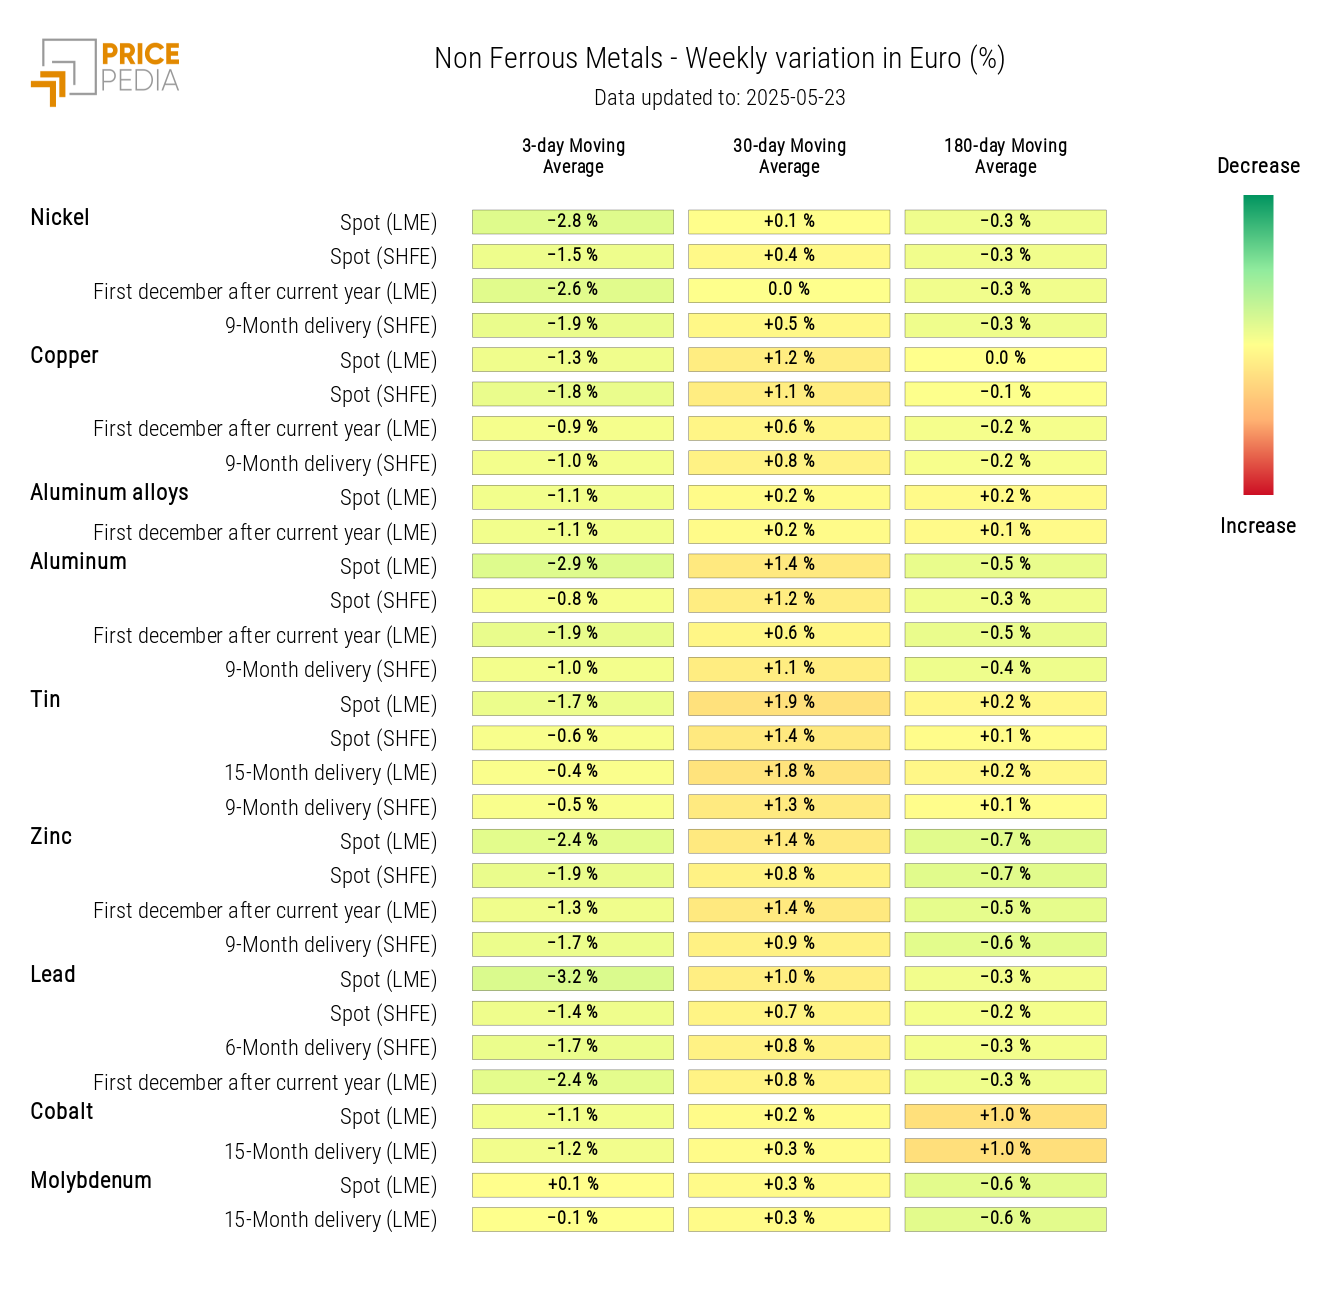
Non-ferrous metals showed greater volatility: the week ended negatively, with the sharpest declines in lead followed by aluminum, due to rising inventories.
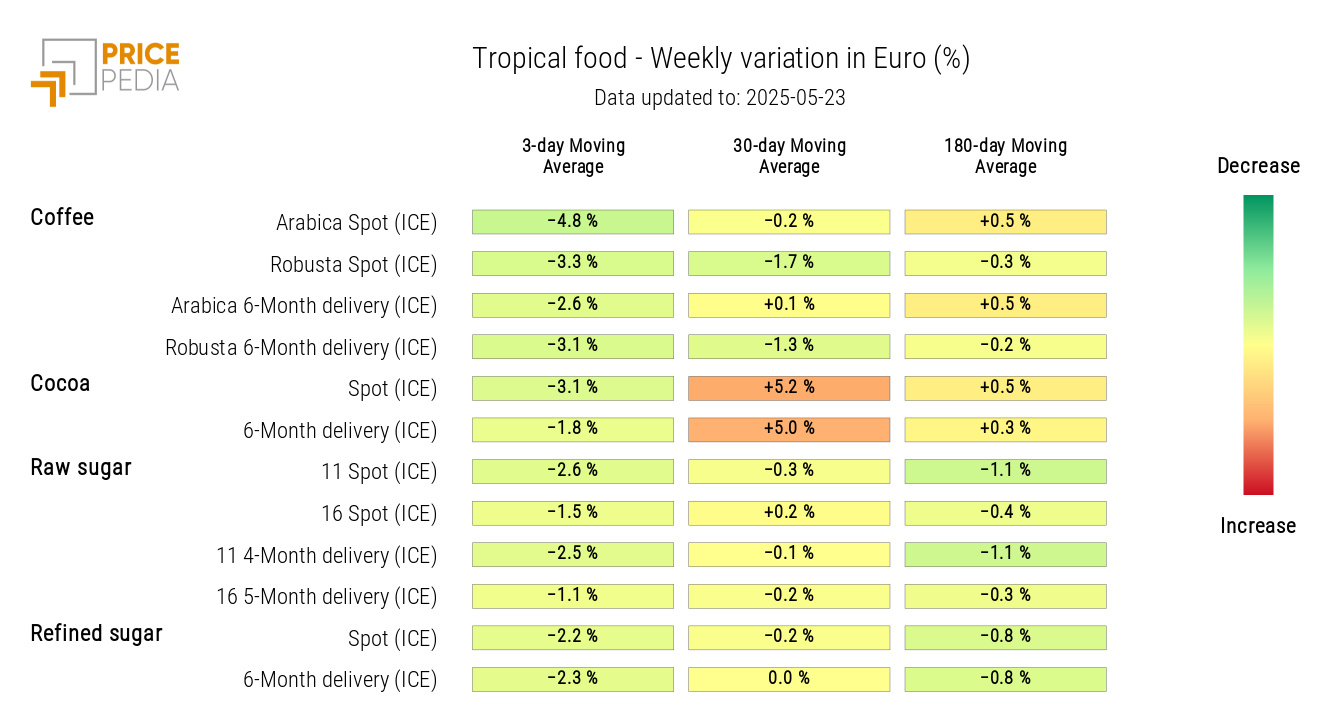
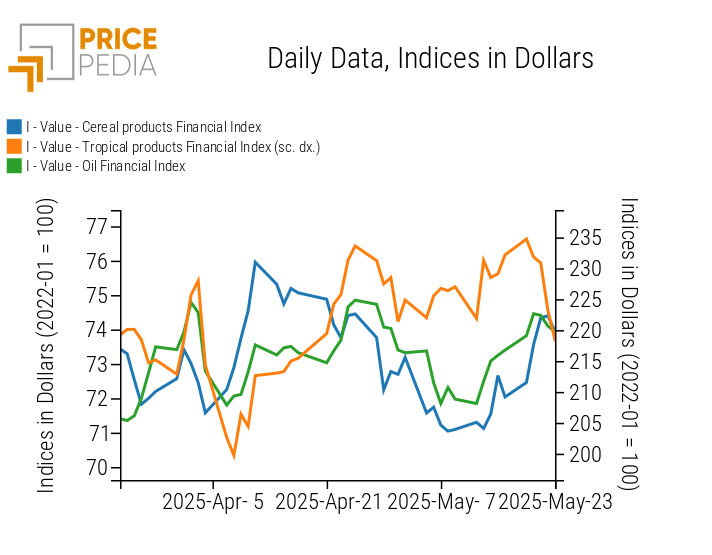
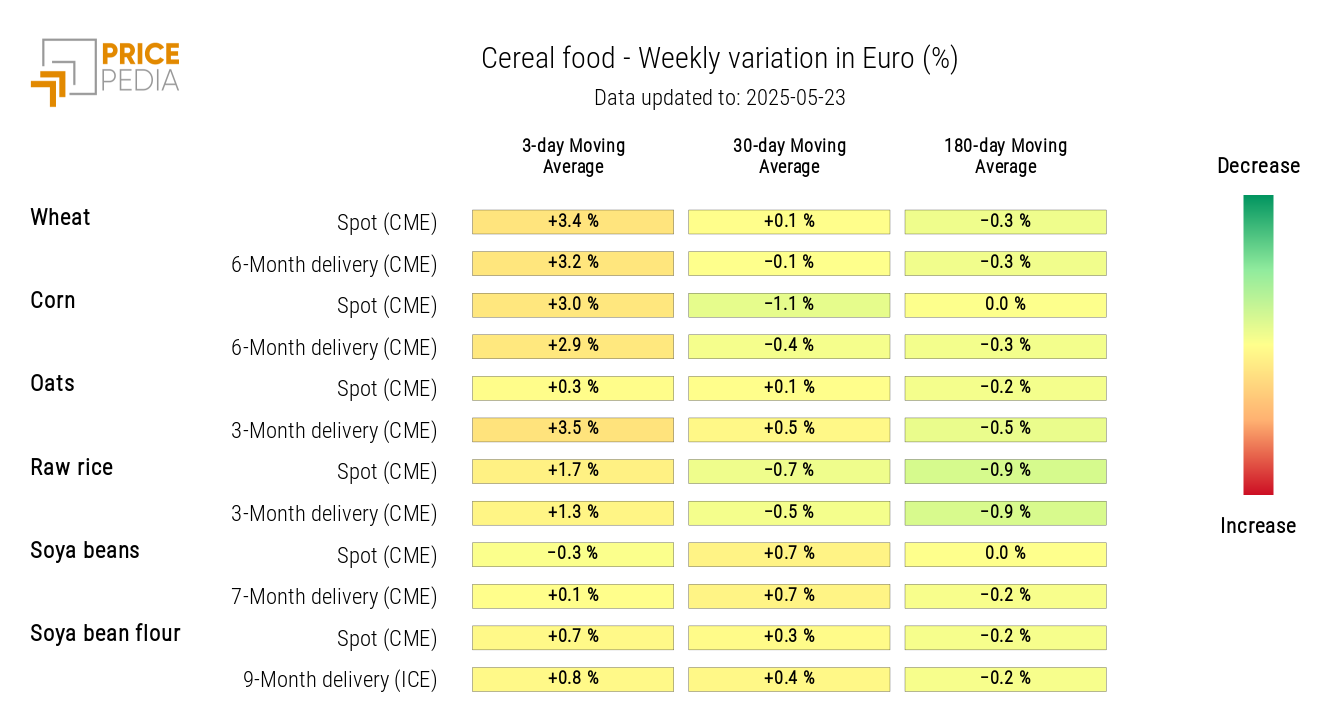
In the food commodities market, vegetable oils and especially grains showed a weekly upward trend, driven by dry weather conditions in the United States. A significant drop in tropical commodity prices was also noted, led by a decline in coffee, caused by rising inventories and upward revisions in production estimates in Brazil and Vietnam.
Macroeconomic Analysis
This week, China’s macroeconomic data indicate a slowdown in industrial production, which came in below expectations, and weaker retail sales growth, pointing to continued fragility in domestic demand.
In Europe, May PMIs fell below the 50 threshold, indicating a contraction in overall economic activity, with a particularly sharp drop in the services sector, influenced by widespread uncertainty among businesses and consumers.
In the United States, PMIs instead show moderate expansion in both manufacturing and services, supported by resilient domestic demand, although concerns remain over inflation and geopolitical risks that could slow growth in the coming months.
NUMERICAL APPENDIX
ENERGY
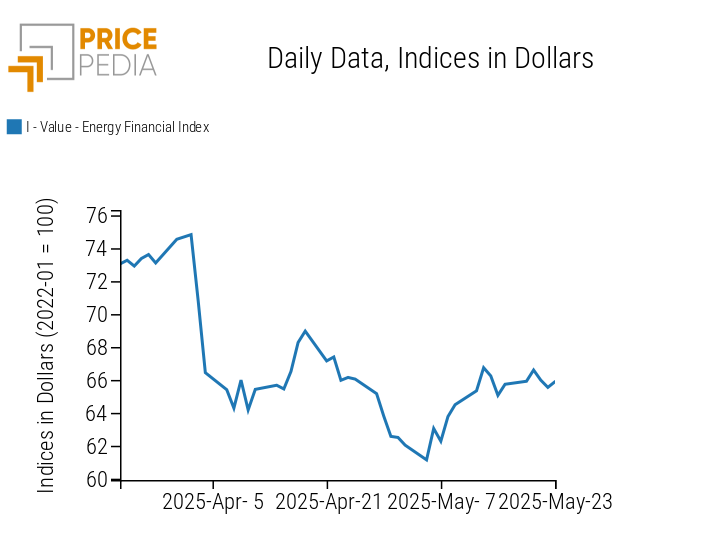
After an initial rise driven by the increase in Dutch TTF gas prices, the PricePedia energy index stabilized, recording only sideways movements.
PricePedia Financial Index of Energy Prices in US Dollars
The energy heatmap shows a decline in oil and US gas prices, alongside increases in Asian LNG, the Italian electricity single price (PUN), and Dutch TTF gas prices.
HeatMap of Energy Prices in Euro
PLASTICS
On Monday, the Chinese financial index for plastics and elastomers reversed most of the gains from the previous week, then showed slight fluctuations.
PricePedia Financial Indices of Plastics Prices in USD
The heatmap of Chinese plastics and elastomers turns green, indicating a generalized decline in prices.
HeatMap of Plastics and Elastomers Prices in EUR
FERROUS METALS
The European ferrous metals index remains mostly sideways, while the Chinese market index declined on Monday before stabilizing.
PricePedia Financial Indices of Ferrous Metal Prices in USD
The heatmap of ferrous metals shows a weekly decrease in Chinese prices of iron ore and hot-rolled coils.
HeatMap of Ferrous Metal Prices in EUR
Do you want to stay up-to-date on commodity market trends?
Sign up for PricePedia newsletter: it's free!
INDUSTRIAL NON-FERROUS METALS
Amid some fluctuations, both non-ferrous metal indices ended the week with falling prices.
PricePedia Financial Indices of Industrial Non-Ferrous Metal Prices in USD
The heatmap analysis highlights a general price drop, more evident for lead, aluminum, nickel, tin, and copper.
HeatMap of Non-Ferrous Metal Prices in EUR
FOOD
The financial index for tropical products shows a weekly drop in prices, while those of edible oils—and especially cereals—record an increase.
PricePedia Financial Indices of Food Prices in USD
CEREALS
The heatmap analysis reveals a weekly increase in wheat and corn prices.
HeatMap of Cereal Prices in EUR
TROPICAL PRODUCTS
The tropical heatmap indicates a generalized price drop, especially for coffee.
HeatMap of Tropical Food Prices in EUR
