US-China truce pushes up commodity prices
Trade policies drive financial commodity prices
Published by Luca Sazzini. .
Conjunctural Indicators Commodities Financial WeekIn last week’s article: Commodity prices waiting for U.S.-China talks, we reported a halt in the decline of commodity prices, supported by expectations of easing trade tensions between the two powers.
These expectations were confirmed by the agreements reached in Geneva between the United States and China, representing a first concrete step towards de-escalating the trade conflict. Both parties recognized the strategic value of a stable and mutually beneficial economic relationship. Starting from May 14, for a period of 90 days, U.S. tariffs on imports from China will be reduced from 145% to 30%, while Chinese duties on U.S. goods will drop from 125% to 10%.
The easing of trade tensions had an immediate impact on financial markets, boosting major global stock indices and strengthening the U.S. dollar.
The following chart shows the performance of the S&P 500 stock index, the main financial benchmark of the U.S. market.
S&P 500 Stock Index
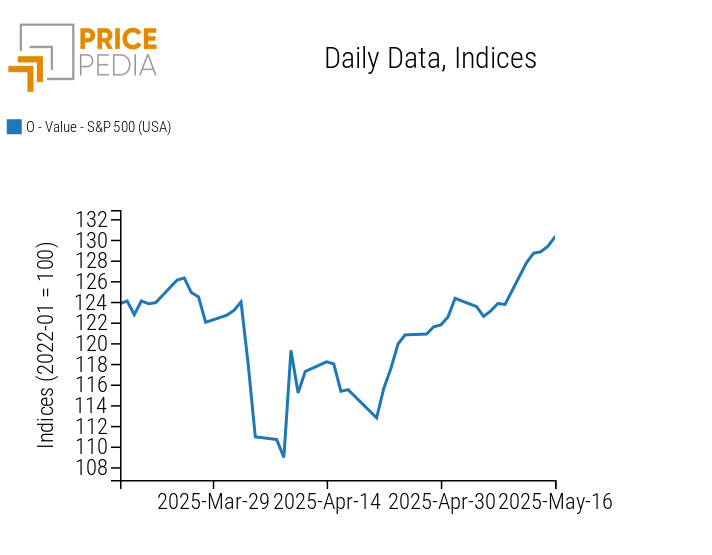
The chart highlights the strong weekly recovery of the S&P 500 stock index, driven by the renewed confidence resulting from the easing of trade tensions.
Weekly Summary of Financial Commodity Prices
This week, the de-escalation of tensions between the United States and China pushed up financial commodity prices, especially oil and industrial metals.
In just two days, the price of Brent rose by more than 4%, driven by the temporary reduction in tariffs between the two powers, a drop in drilling activity in the U.S. due to low prices, and Trump’s threats to block Iranian oil exports if a nuclear deal is not reached.
However, starting Wednesday, oil prices began to fall again following Trump's statements that the U.S. and Iran were close to a new nuclear agreement. If such a deal were to result in the removal of U.S. sanctions on Iranian oil, much of the supply risk would dissipate, with Tehran ready to ramp up its output. This potential increase in supply, combined with rising production by OPEC+, could further exacerbate the current market oversupply.
In the Dutch TTF natural gas market, last week's price rise continued for the first two days, then stabilized within a €35-36 /MWh range.
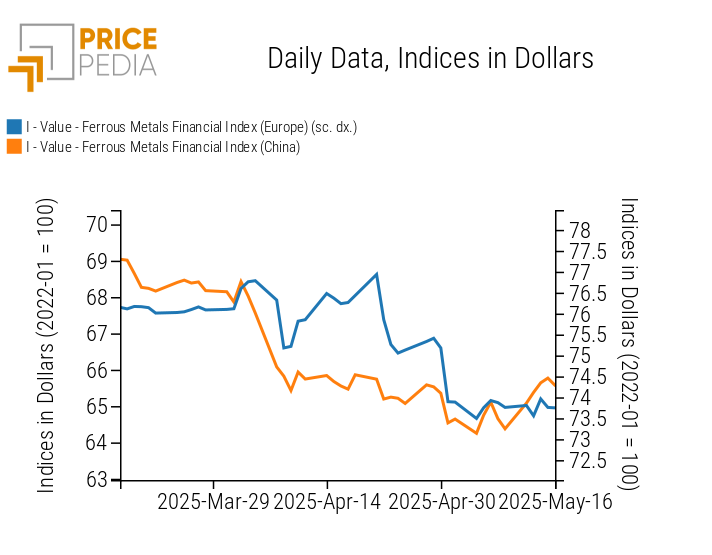
In the ferrous metals market, European prices moved sideways, while prices in China rose, supported by new trade agreements with the United States. In particular, the price of iron ore traded on the Dalian Commodity Exchange (DCE) exceeded $110/ton, marking a 6% increase compared to last week's close.
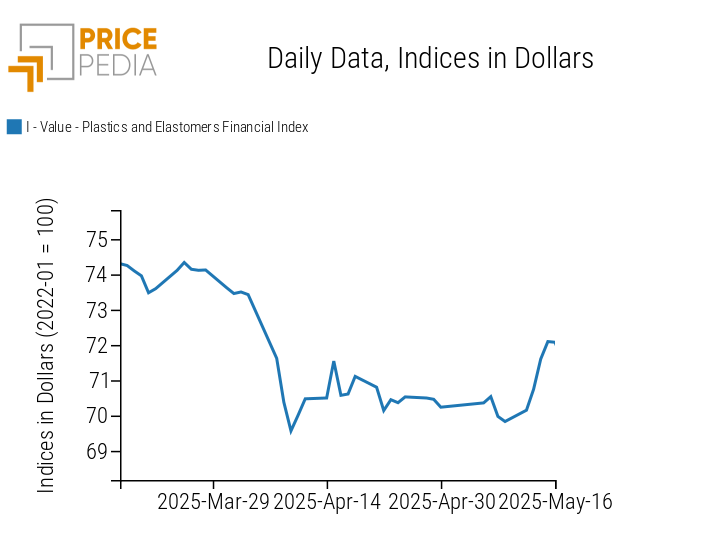
A clear sign of improving growth expectations in China’s industry also emerges from the plastics and elastomers price index quoted on Chinese financial markets (Shanghai Futures Exchange and Dalian Commodity Exchange). This index rose by more than 3% in dollar terms this week.
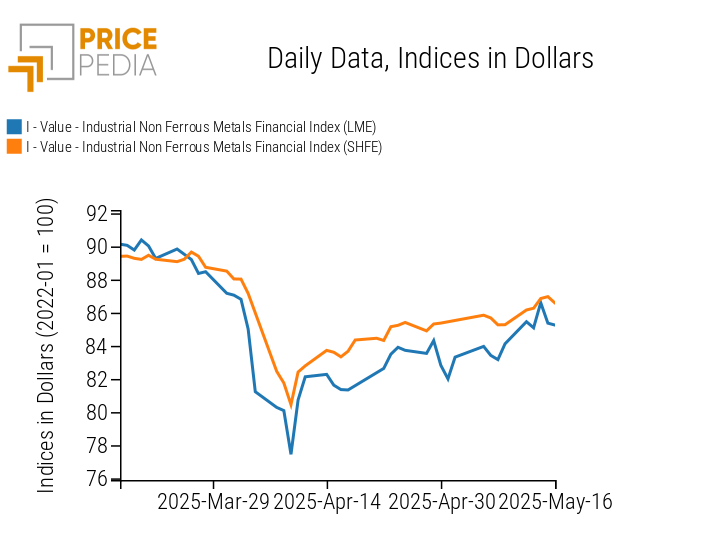
The non-ferrous metals market also experienced price increases, though with varying dynamics depending on the market. In Shanghai, financial prices showed steady growth, supported both by easing trade tensions and by declining domestic inventories: copper stocks fell for the seventh consecutive week, while aluminum stocks declined for the sixth.
On the London market (LME), prices were more volatile, with sharp and sometimes opposing daily fluctuations, though they ended the week higher than the previous Friday.
The price of gold, by contrast, declined, losing some of its appeal as a safe haven due to easing trade tensions, prospects for a U.S.-Iran nuclear deal, and a ceasefire between India and Pakistan.
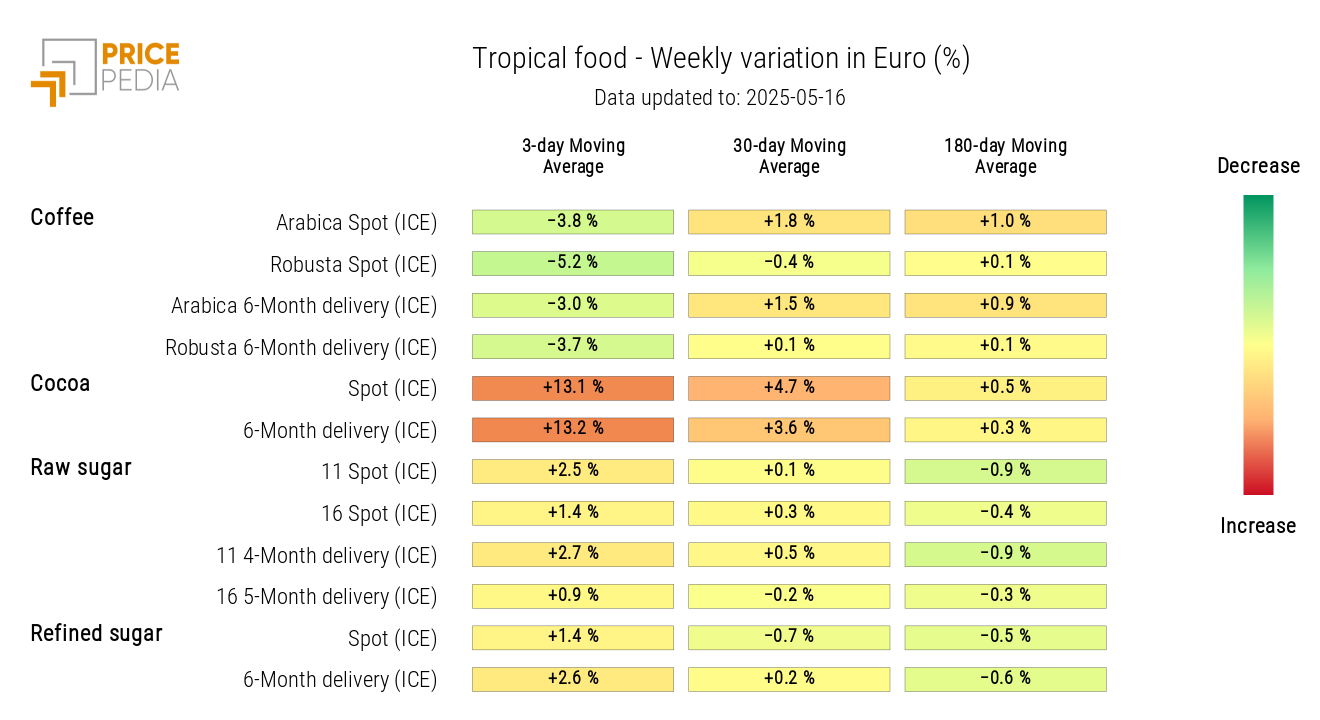
The food commodity market saw a general price increase, especially for cocoa, which rose by 9% on Tuesday alone. This unusual surge is attributed to crop quality issues in Ivory Coast, one of the main exporting countries, where cocoa processors reported that 5-6% of the beans harvested showed poor characteristics. The quality deterioration, partly caused by late rains that compromised crop development, contributed to a downward revision of the average mid-crop estimate for Ivory Coast to 400,000 tons, down 9% from last year's 440,000 tons.
Finally, a decline in the financial prices of coffee was noted, driven by expectations of increased global supply, confirmed by upward revisions to forecast production in Honduras and Brazil for the 2025/26 cycle.
U.S. Inflation
Inflation in the United States unexpectedly slowed in April, with the Consumer Price Index (CPI) dropping to 2.3% year-on-year, the lowest level since February 2021. The decline was mainly due to falling food prices, which decreased by 0.1% on a monthly basis. However, core inflation, which excludes volatile food and energy prices, rose to 2.8%, signaling persistent pressures in sectors like rent, auto insurance, and healthcare.
There are still potential risks of an inflation rebound linked to U.S. trade policy. Overall, the FED is expected to adopt a cautious approach and likely keep interest rates unchanged until the effects of the new tariffs become clearer.
NUMERICAL APPENDIX
ENERGY
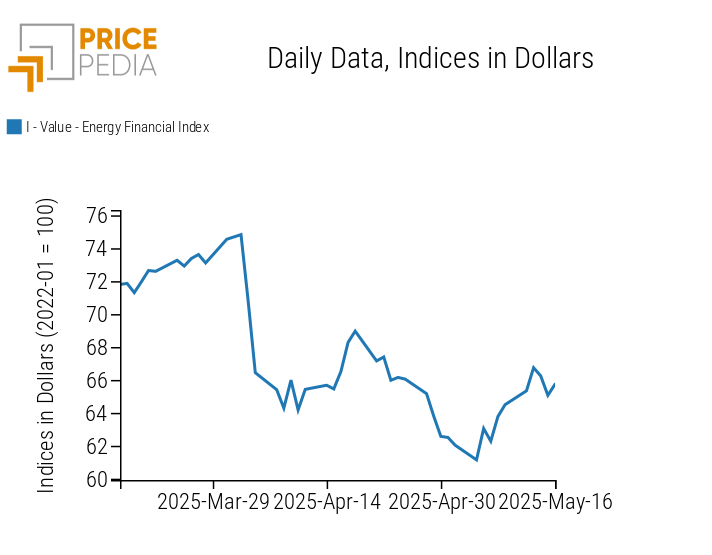
After a sharp initial rise, the PricePedia energy index reversed its trend following news of a possible nuclear deal between the United States and Iran.
PricePedia Financial Index of Energy Prices in Dollars
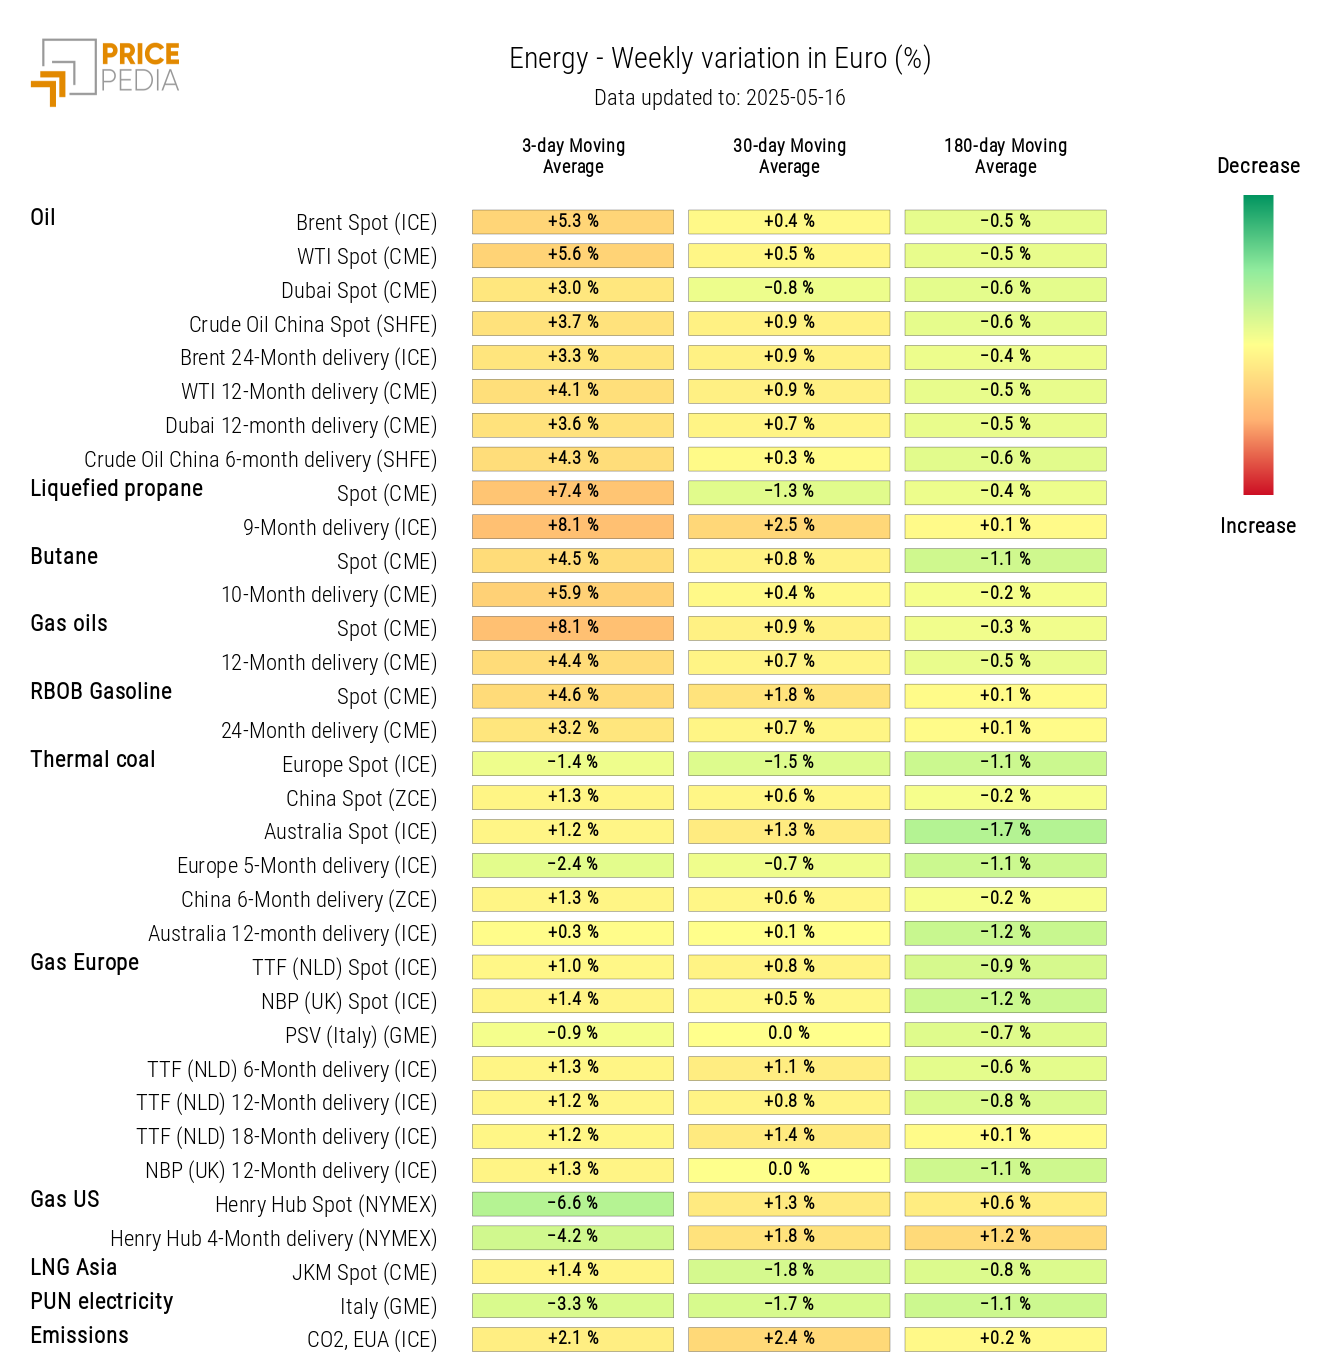
The energy heatmap shows a rise in oil and derivative prices, while U.S. gas prices declined.
HeatMap of Energy Prices in Euro
PLASTICS
The Chinese financial index of plastics and elastomers shows a significant rise in prices.
PricePedia Financial Indices of Plastic Prices in Dollars
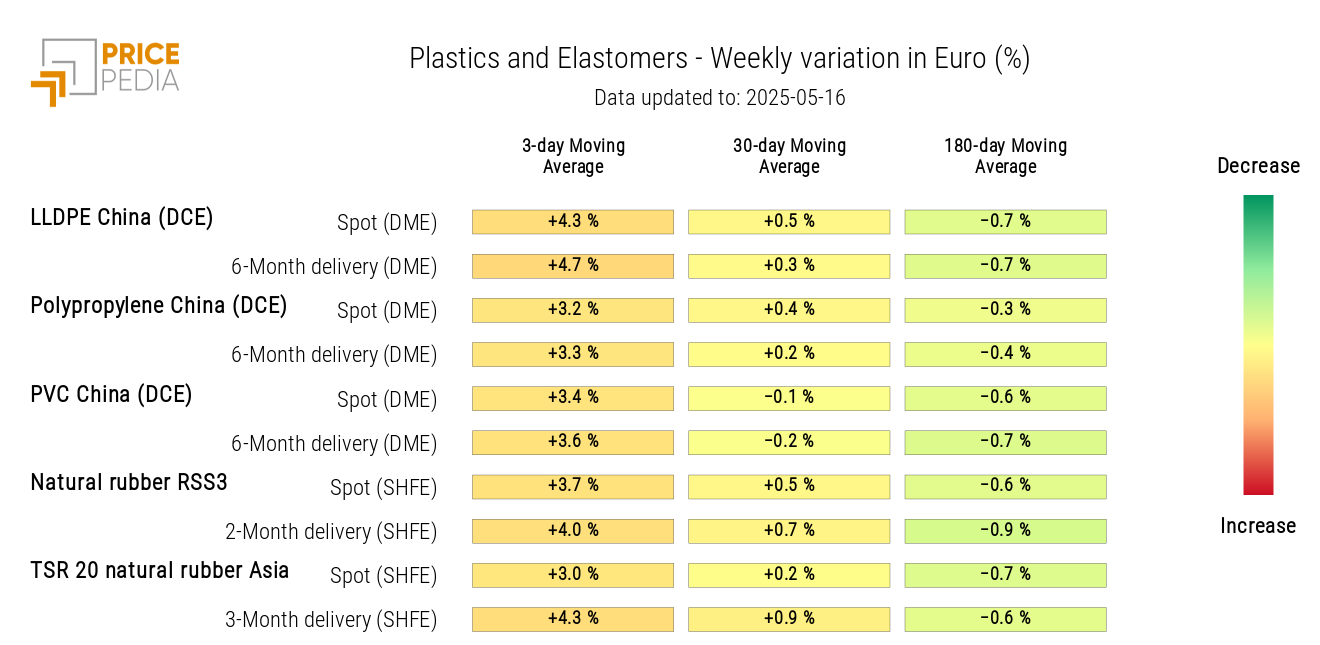
All prices in the heatmap of plastics and elastomers show increases.
HeatMap of Plastic and Elastomer Prices in Euro
FERROUS METALS
This week, the PricePedia index of European ferrous metals remained stable, while the Chinese index showed an upward trend.
PricePedia Financial Indices of Ferrous Metal Prices in Dollars
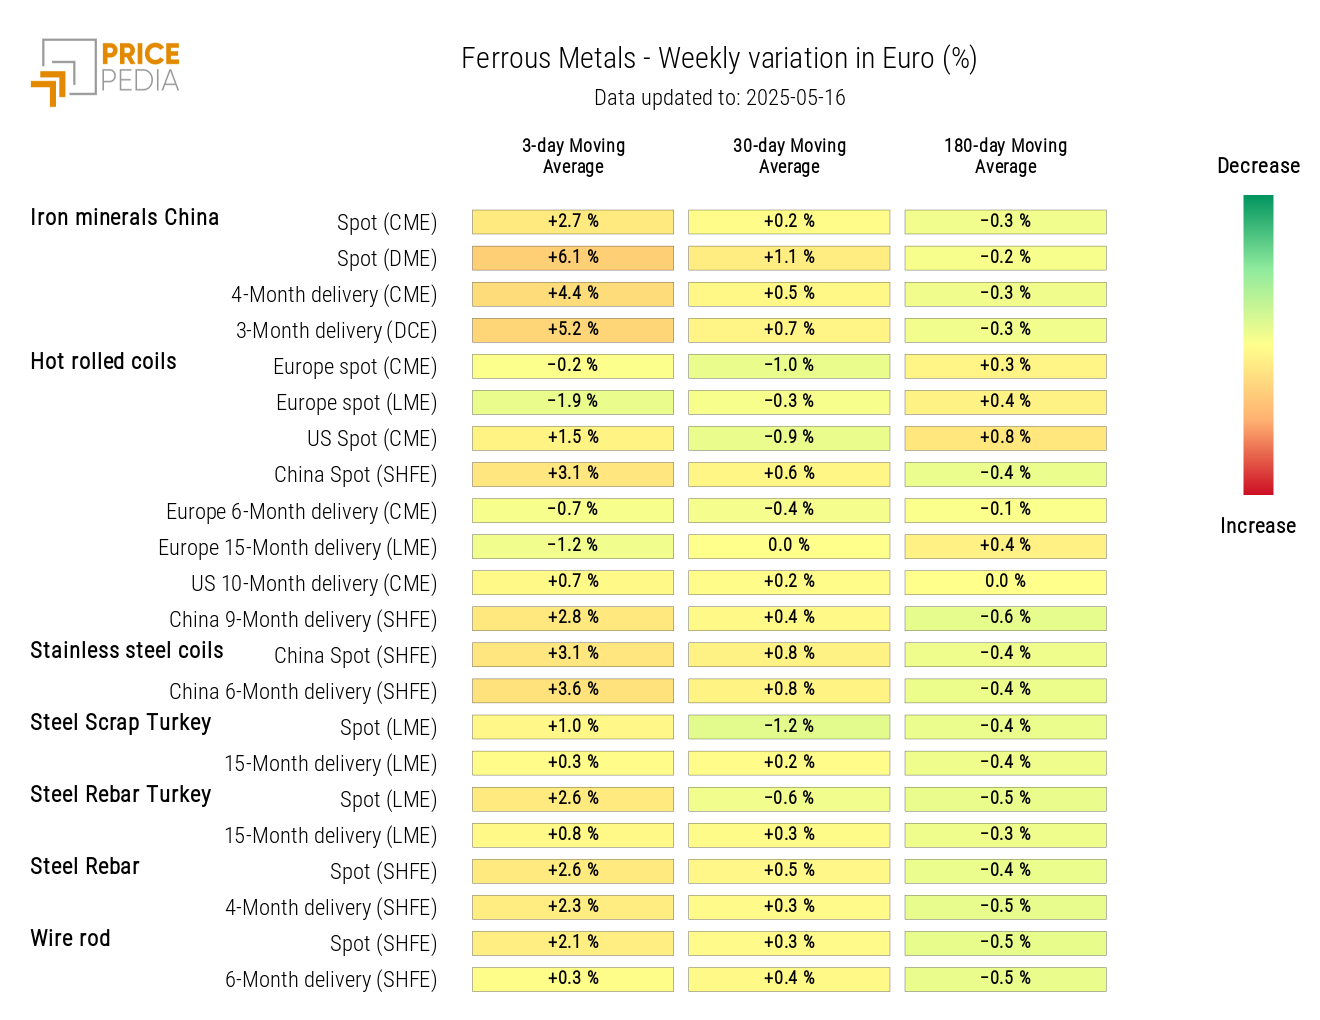
The heatmap analysis highlights a general rise in ferrous metals, especially in Chinese iron ore and stainless steel coil prices.
HeatMap of Ferrous Metal Prices in Euro
Do you want to stay up-to-date on commodity market trends?
Sign up for PricePedia newsletter: it's free!
NON-FERROUS INDUSTRIAL METALS
The SHFE non-ferrous metals index shows continuous weekly growth, while the LME index saw a weekly rise dampened by some daily corrections.
PricePedia Financial Indices of Non-Ferrous Industrial Metal Prices in Dollars
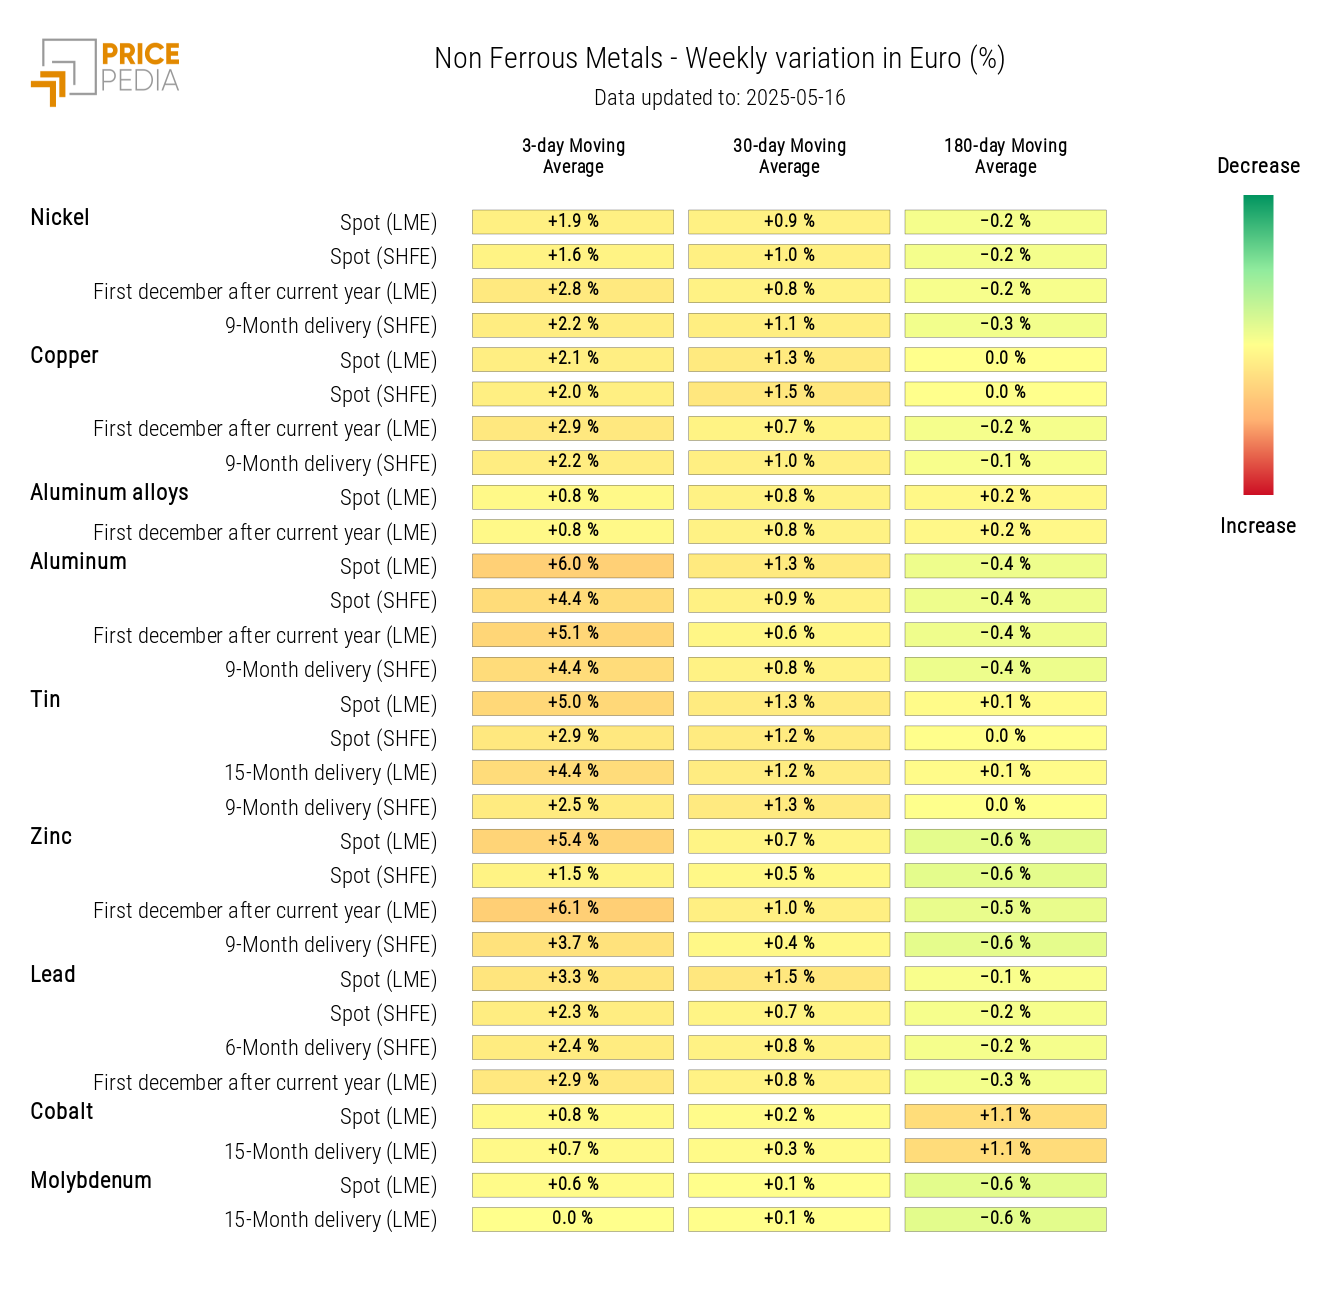
The non-ferrous heatmap shows a sharp increase in aluminum, tin, and zinc prices.
HeatMap of Non-Ferrous Metal Prices in Euro
FOOD
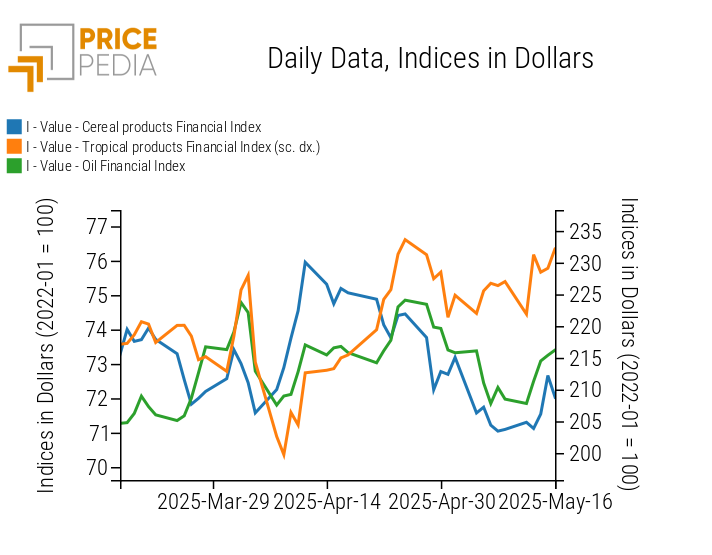
Despite some fluctuations, the financial indices of food products all recorded weekly price increases.
PricePedia Financial Indices of Food Prices in Dollars
CEREALS
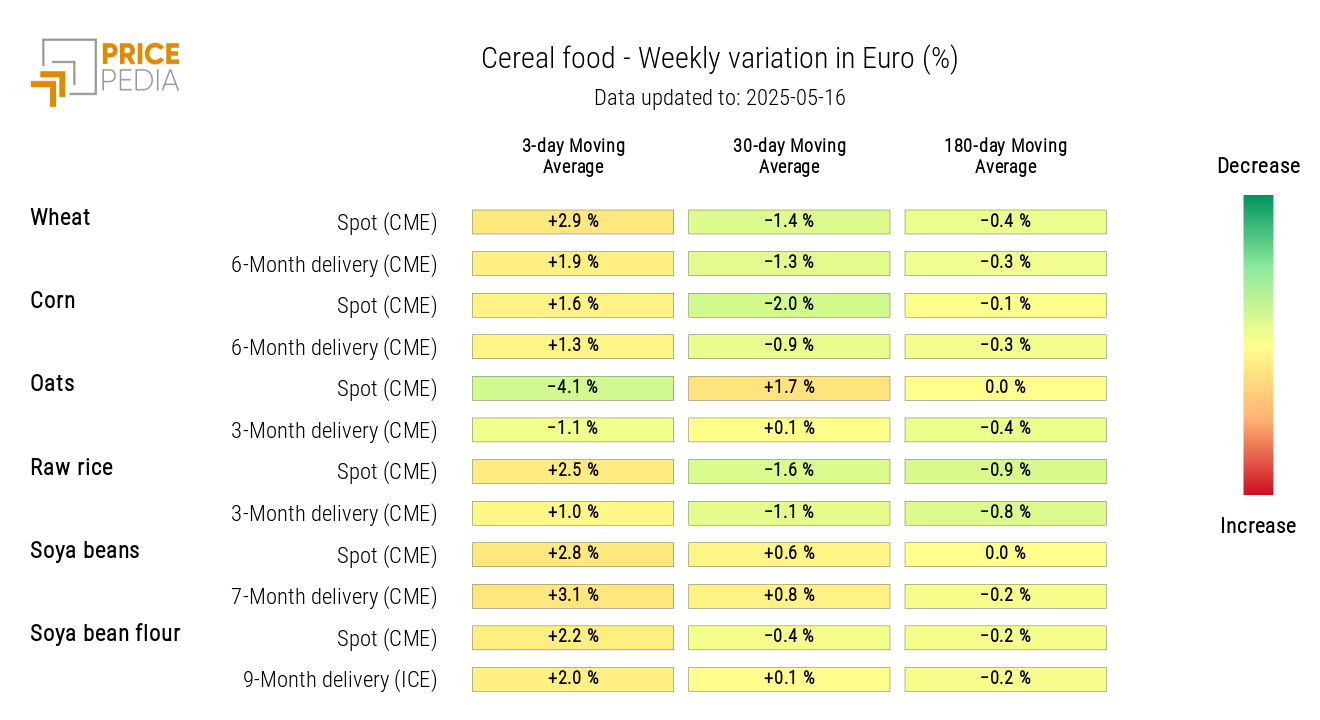
The heatmap analysis shows a weekly increase in cereal prices, except for oats.
HeatMap of Cereal Prices in Euro
TROPICAL PRODUCTS
The tropical products heatmap highlights the sharp weekly increase in cocoa prices and the drop in coffee prices.
HeatMap of Tropical Food Prices in Euro
OILS
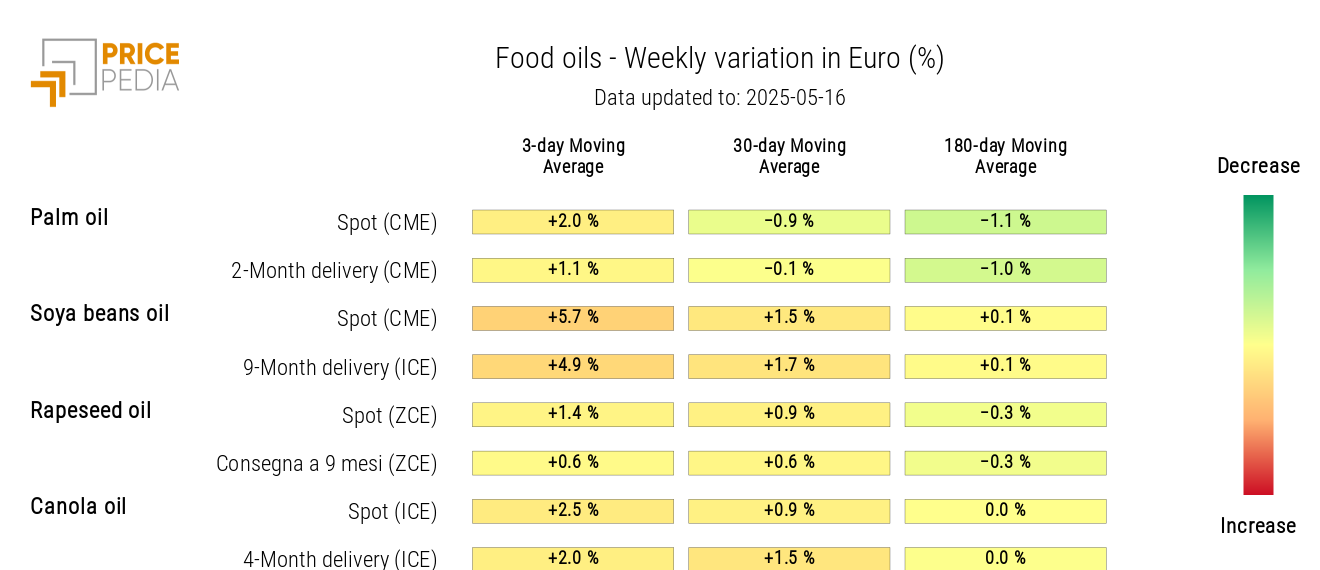
The edible oils heatmap indicates a general price increase, especially for soybean oil.
HeatMap of Edible Oil Prices in Euro
