Cost pass-through: regression analysis of electric cable prices
Price transmission: impact of changes in copper and aluminum wire prices on those of electric cables
Published by Luca Sazzini. .
Copper Non Ferrous Metals Aluminium Cost pass-through
In last week’s article: Analysis of copper wire prices: the heart of the modern electrical industry, we conducted an analysis of copper wire prices (obtained by simply drawing copper rod) and electric cables (made from copper and/or aluminum wires and one or more layers of insulating material). The analysis showed that the price dynamics of cables tend to closely follow those of copper wires, their main production input. This is consistent with the economic theory of cost pass-through, which states that changes in input prices are at least partially reflected in the prices of final products.
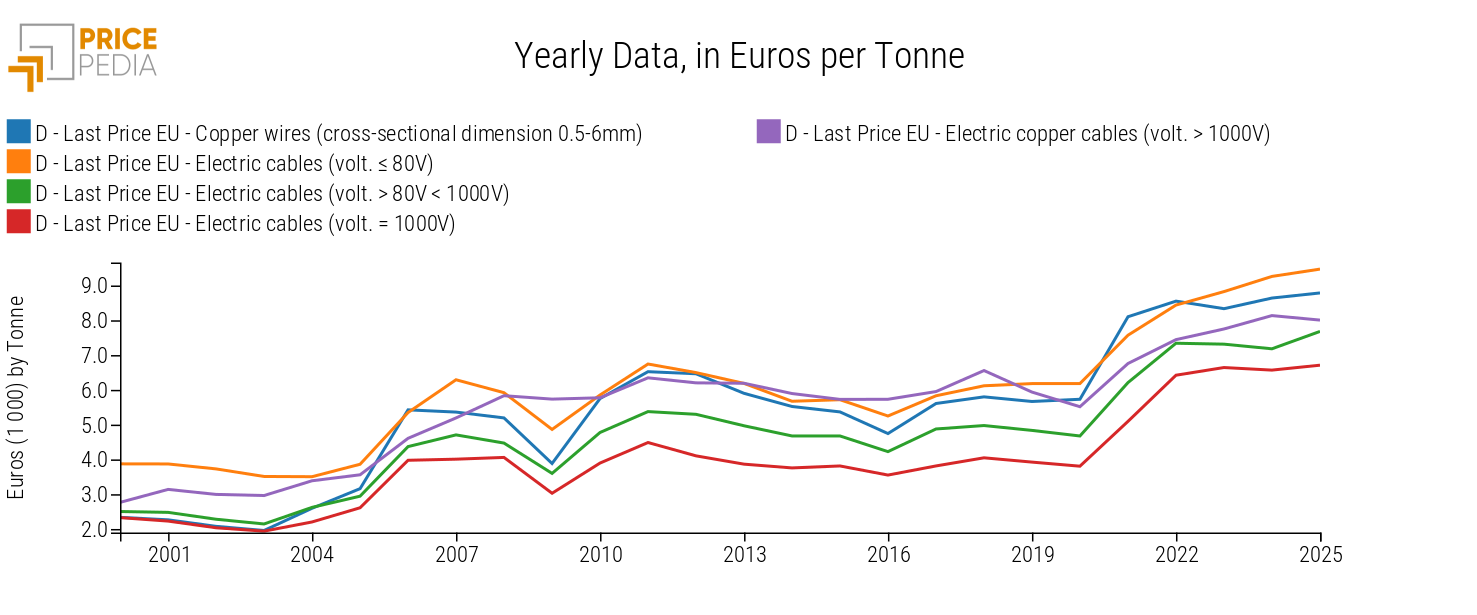
The following chart shows the annual price trends of copper wires and four different types of electric cables, expressed in euros per ton.
Historical price series of copper wires and electric cables, expressed in euros/ton

The chart analysis highlights the common dynamics between copper wire prices and electric cable prices.
From the analysis of historical series, the main price increases occurred between 2003–2007 and during 2021–2022. Conversely, the main declines were observed in the years 2007, 2016, and 2020.
In this article, we will further explore the relationship between copper wire trends and those of electric cables, using statistical regression to estimate the impact of production costs on the final price of electric cables.
Regression Model
In this analysis, the chosen regression models are based exclusively on production costs. The dependent variables of the models are the prices of electric cables, while the explanatory variables common to all models are:
- The price of copper and aluminum wires: the main inputs for the production of electric cables;
- The price index of plastics and elastomers: used as insulating coatings in electric cables;
- The euro area consumer price index: used as a proxy for labor and service costs involved in the production process, assuming wages and services are indexed to inflation.
With the exception of the model for fully copper electric cables (those with voltage above 1000 V), all other models include both copper and unalloyed aluminum wire prices as regressors. While less common than copper, aluminum wires represent a valid alternative due to their lower production cost and reduced weight, while still ensuring adequate conductivity for many applications.
To interpret the estimation results in terms of elasticity, a logarithmic transformation was applied to all variables in each model.
Long-Term Estimates
The table below reports the long-term price estimates for electric cables, calculated using the dynamic specification model of Engle and Granger.[1]
Table of long-term estimation results for electric cables
| Long-term equation regressors | Adjusted R² | ||||
|---|---|---|---|---|---|
| Price of copper wires | Price of unalloyed aluminum wires | Price index of plastics and elastomers | Euro area consumer price index | ||
| Cables with copper and aluminum wires | |||||
| Electric cables (voltage < 80V) | 0.48 | 0.15 | 0.12 | 0.21 | 0.94 |
| Electric cables (voltage ≥ 80V < 1000V) | 0.56 | 0.10 | 0.30 | 0.33 | 0.99 |
| Electric cables (voltage = 1000V) | 0.48 | 0.40 | 0.11 | 0.36 | 0.97 |
| Cables with only copper wires | |||||
| Copper electric cables (voltage > 1000V) | 0.41 | / | 0.51 | 0.38 | 0.88 |
The estimated long-term coefficients are all positive and statistically significant, in line with the expectations of economic theory.
The elasticity of electric cable prices to changes in copper wire prices is always higher than that estimated for unalloyed aluminum wires.
The cost pass-through of raw materials used in electric cable production tends to be generally very high, ranging between 0.92 and 0.99, except for cables intended for civil use and small installations, i.e. those with voltage below 80V. In this latter case, the estimated cost pass-through is 0.75 (sum of the coefficients: 0.48 + 0.15 + 0.12). This implies that, all else being equal (ceteris paribus), a 10% increase (or decrease) in raw material prices leads, on average, to a 7.5% increase (or decrease) in the price of low-voltage cables.
The adjusted R² value, a goodness-of-fit indicator for the estimated model that ranges from 0 to 1, is consistently very high across all models. The lowest value is recorded for the copper electric cables with voltage above 1000V, where the adjusted R² is 0.88. This means that even in this case, the model captures the predominant part (88%) of the long-term price variation of this product.
Do you want to stay up-to-date on commodity market trends?
Sign up for PricePedia newsletter: it's free!
Short-Term Estimates
In order to analyze the adjustment dynamics of electric cable prices, the following section presents the short-term estimation results, calculated by applying the Error Correction Model (ECM) to the long-term equations.[1]
Table of short-term estimation results for electric cables
| Impact Effect | Adjustment Coefficient | Adjusted R2 | |
|---|---|---|---|
| Cables with copper and aluminum wires | |||
| Electric cables (voltage < 80V) | 0.27 | - 0.27 | 0.14 |
| Electric cables (voltage ≥ 80V < 1000V) | 0.67 | - 0.57 | 0.50 |
| Electric cables (voltage = 1000V) | 0.72 | - 0.42 | 0.41 |
| Cables with only copper wires | |||
| Copper electric cables (voltage > 1000V) | 0.60 | - 0.48 | 0.27 |
Except for electric cables with voltage < 80V, which have an estimated impact effect coefficient of “only” 0.27, the other electric cable models show a high estimate of the initial shock (always equal to or greater than 0.60). This indicates that for these products, at least 60% of the variations in price determinants are instantly transmitted to the price of electric cables.
In absolute terms, electric cables with voltage between 80 and 1000V show the highest adjustment coefficient, estimated at -0.57. This means that, each period, 57% of the gap between the historical and long-term theoretical value is corrected.
The R² of the short-term equations is relatively low, which is entirely normal considering that in this case the index measures the model’s ability not only to capture long-term price level variations, but also short-term fluctuations, which are often more irregular and harder to explain.
Conclusions
The analysis of the estimation results shows that the cost pass-through of the raw materials used in the production of electric cables tends to range between 0.92 and 0.99, with the exception of cables with voltage lower than 80V, for which the estimated value is 0.75.
All estimated coefficients have positive signs, with the coefficients for copper wires consistently higher than those for unalloyed aluminum wires.
Excluding electric cables with voltage below 80V, most price shocks in the determinants are immediately passed on to the price of electric cables.
The R² coefficients of the long-term estimated models indicate a strong ability of the models to explain electric cable prices.
[1] For a more detailed discussion of the Engle and Granger model, see the article: Cost pass-through of hot-rolled austenitic coil prices


