Demand fears put pressure on commodity prices
Commodity: concerns over macroeconomic data from the US and China
Published by Luca Sazzini. .
Conjunctural Indicators Commodities Financial WeekWeekly Summary of Commodity Financial Prices
This week, financial markets for commodities showed a predominantly bearish trend, due to renewed concerns on the demand side following the release of disappointing macroeconomic data from the United States and China.
The sector that recorded the sharpest decline was the energy sector, mainly driven by the drop in the price of oil. Several factors contributed to the decrease in crude oil prices over the week:
- the decline in the U.S. consumer confidence index;
- the unexpected contraction of U.S. GDP;
- the increase in production by OPEC+, ahead of the Monday, May 5 meeting;
- the unexpected rise in U.S. weekly crude oil inventories, contrary to market expectations.
These factors pushed oil prices to levels near $60/barrel, well below the informal threshold of $80/barrel that guides OPEC+ decisions.
Current prices were defined as "an opportunity" by U.S. Energy Secretary Chris Wright, who stated that the country will continue to rebuild its strategic reserves, taking advantage of the current favorable oil prices.
In the Euroopean natural gas market, TTF (Netherlands) prices hovered around €32/MWh, down more than €20/MWh compared to levels three months ago.
Even gold, traditionally considered the ultimate safe-haven asset, experienced significant declines during the week due to a drop in domestic consumption in China. The China Gold Association announced this week that in the first quarter of 2025, gold consumption in China fell by -6% compared to the same period the previous year.
In the industrial metals sector, financial prices declined for both ferrous and non-ferrous metals. Notably, on Wednesday alone, the price of copper dropped by -3% on the LME and -5.5% on the CME, due to new negative U.S. quarterly GDP data and a drop in China’s manufacturing PMI.
The International Copper Study Group (ICSG) forecasted a supply surplus in 2025, mainly due to increased mining production, expanded Chinese smelting capacity, and the startup of new refineries in India, Indonesia, and the Democratic Republic of the Congo. However, in the very short term, supply-side tensions may arise due to a progressive decline in copper inventories in China. In this context, copper prices rebounded on Friday morning, also supported by Beijing’s announcement of new trade negotiations with the United States, which helped improve market sentiment.
Negative weekly price dynamics also prevailed in the financial markets of food commodities, particularly in the tropical and edible oils segments.
In the coffee market, the price differential between arabica and robusta remains particularly wide. Brazil's agricultural agency CONAB expects a decrease in arabica coffee production, although a possible increase in robusta coffee output is forecast.
Global Economic Outlook
U.S. Quarterly GDP
The quarterly GDP of the United States declined by -0.3%, compared to expectations of +0.2% and +2.4% recorded in the previous quarter. These figures further raised analysts’ expectations of a possible U.S. economic recession.
The impact on the stock market was almost entirely offset by positive earnings reports from U.S. companies. The S&P 500, in fact, after a slight initial dip, closed Wednesday in positive territory, while the NASDAQ 100 index remained almost stable, with a modest -0.09% decline.
In commodity financial markets, however, the price decline was more pronounced due to concerns over future demand.
Euroo Area Inflation
Inflation in the Euroo area remained stable at 2.2%, contrary to expectations of a one-tenth percentage point decrease.
The core Consumer Price Index (CPI), which excludes the most volatile components, rose from 2.4% to 2.7%, compared to the 2.5% forecast by analysts.
Despite data showing price levels slightly above expectations, analysts remain confident in a gradual and sustainable return of inflation toward the 2% target. As a result, markets continue to price in a 25-basis-point interest rate cut by the Euroopean Central Bank (ECB) at the upcoming June 5 meeting.
China PMI
In April, the average of the two Chinese manufacturing PMI indices (NBS and Caixin) fell from 50.9 to 49.7, indicating a slight contraction in activity after two consecutive months of growth, mainly due to a decline in foreign demand. This drop partly contributed to the decrease in non-ferrous metal financial prices, which remain sensitive to trends in China’s manufacturing sector.
NUMERICAL APPENDIX
ENERGY
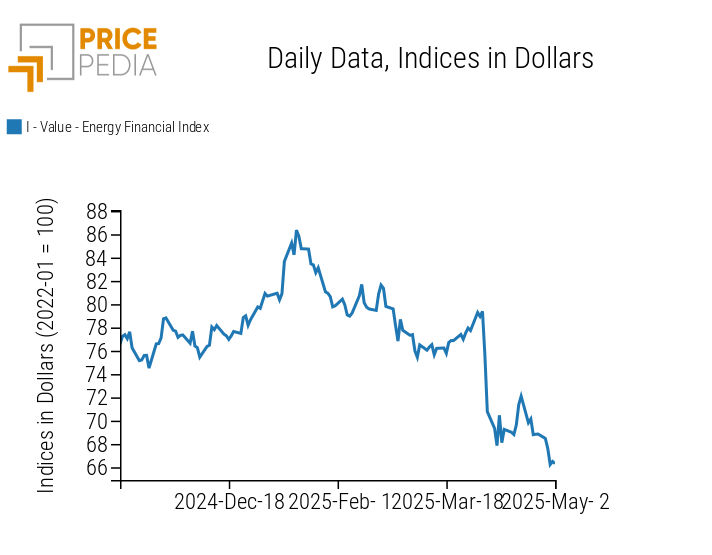
The PricePedia financial index of energy products shows a downward trend driven by falling oil prices.
PricePedia Financial Index of Energy Prices in Dollars
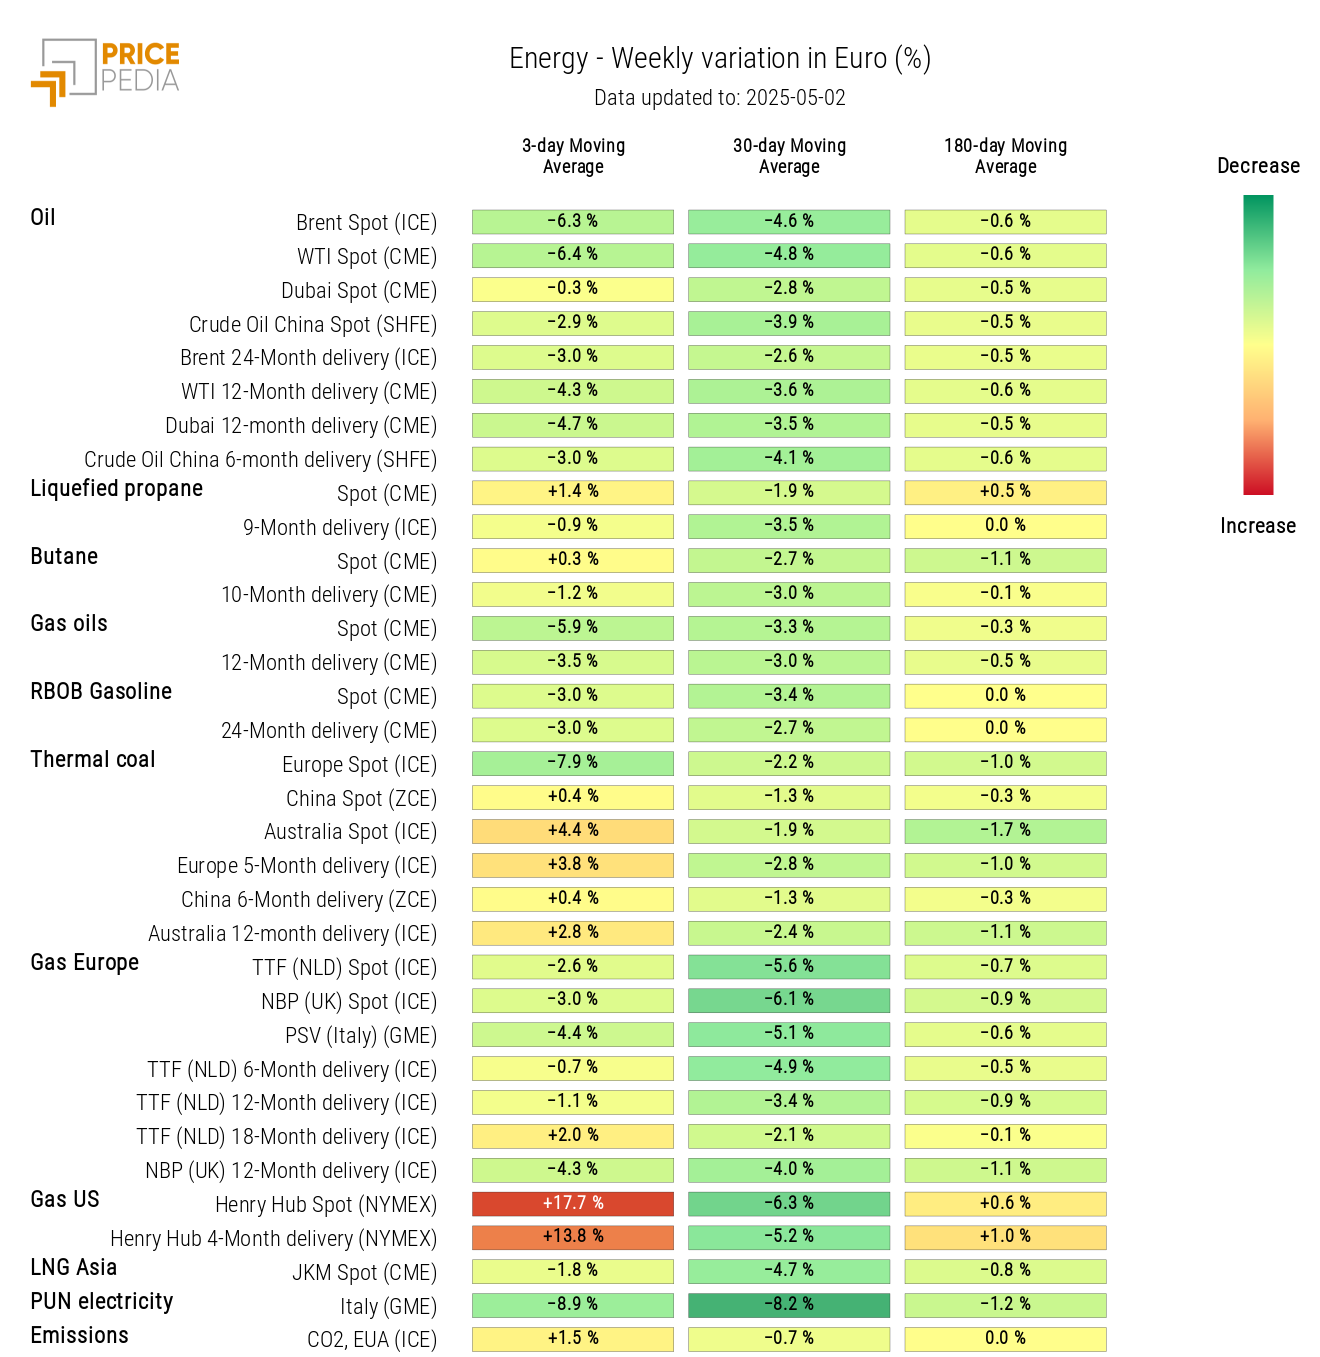
The PricePedia energy heatmap highlights the drop in the prices of oil, thermal coal, TTF natural gas, and the Italian PUN, alongside a rise in U.S. Henry Hub gas prices.
HeatMap of Energy Prices in Euro
PLASTICS
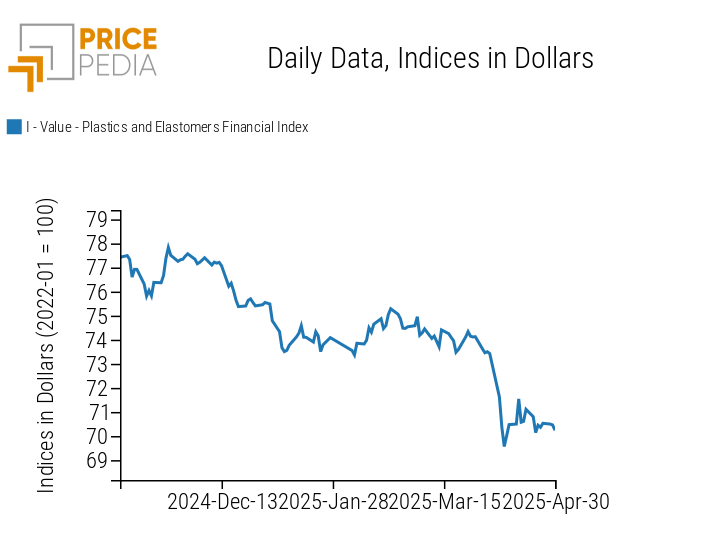
The financial index of plastics and elastomers, in line with the decline in the energy price index, showed a downward trend.
The index trend is only updated through the end of April due to the closure of Chinese financial markets from May 1 to 5 for Labor Day holidays.
PricePedia Financial Indices of Plastic Prices in Dollars
FERROUS METALS
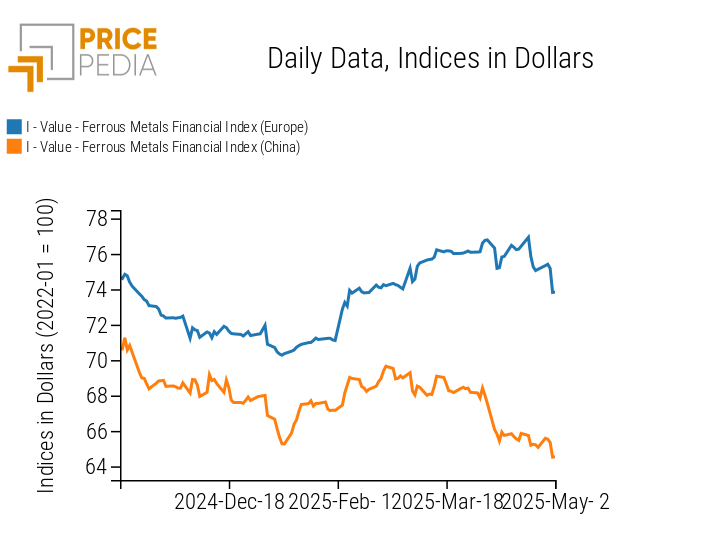
The two indices of ferrous metals are both showing a downward price trend.
PricePedia Financial Indices of Ferrous Metal Prices in Dollars
Do you want to stay up-to-date on commodity market trends?
Sign up for PricePedia newsletter: it's free!
INDUSTRIAL NON-FERROUS METALS
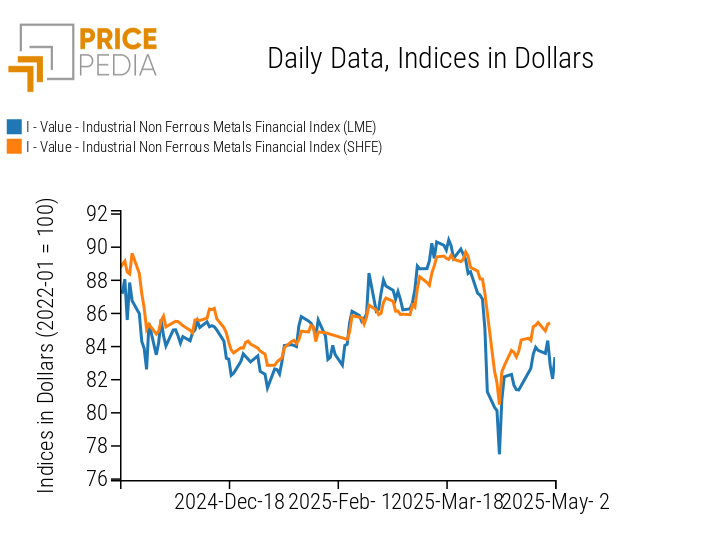
The LME non-ferrous metal financial index declines following the release of negative macroeconomic data from the United States and China, then recovers on Friday supported by news of Beijing's willingness to seek a deal on tariffs imposed by the Trump administration.
PricePedia Financial Indices of Industrial Non-Ferrous Metal Prices in Dollars
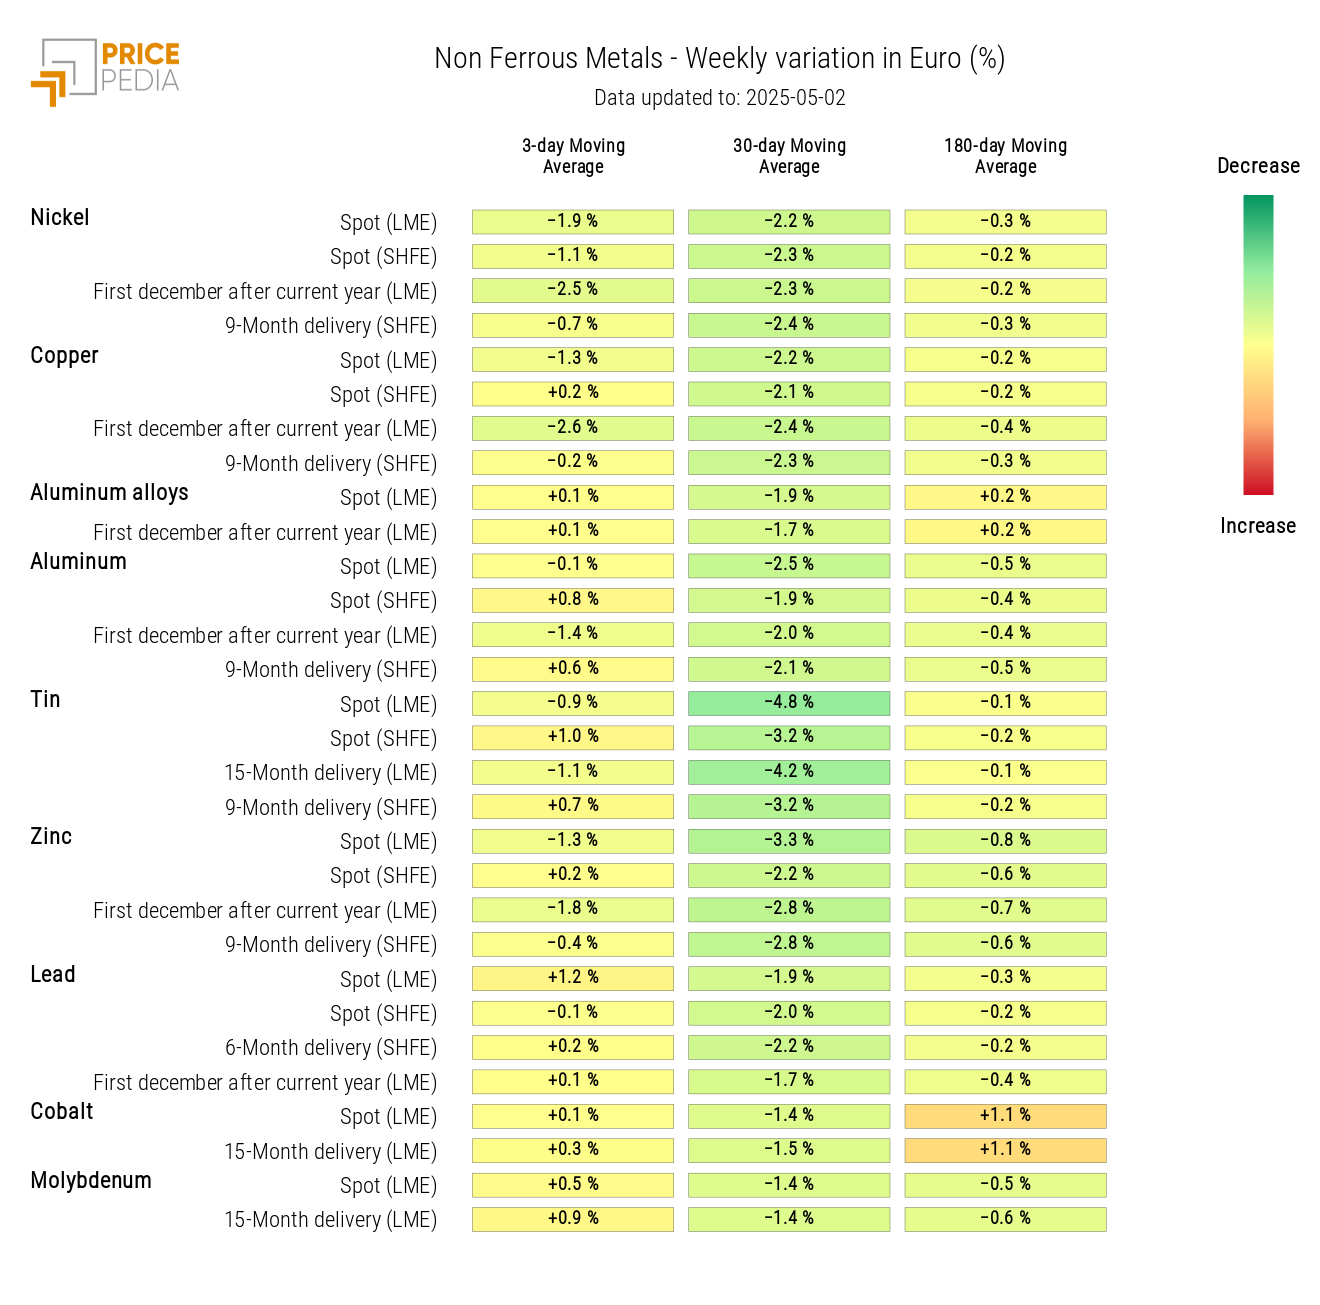
The non-ferrous heatmap highlights the weekly decline in the 3-day moving average prices of nickel and copper.
HeatMap of Non-Ferrous Metal Prices in Euro
FOOD PRODUCTS
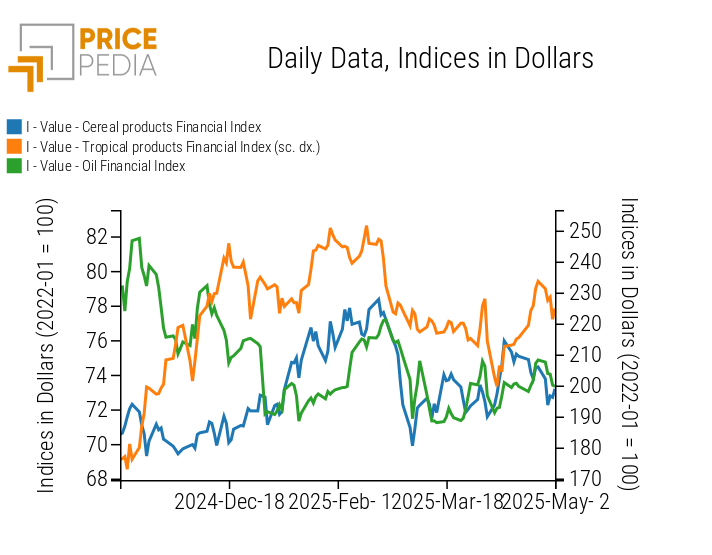
This week shows an overall decline in food indices, more pronounced for tropical and edible oils.
PricePedia Financial Indices of Food Prices in Dollars
CEREALS
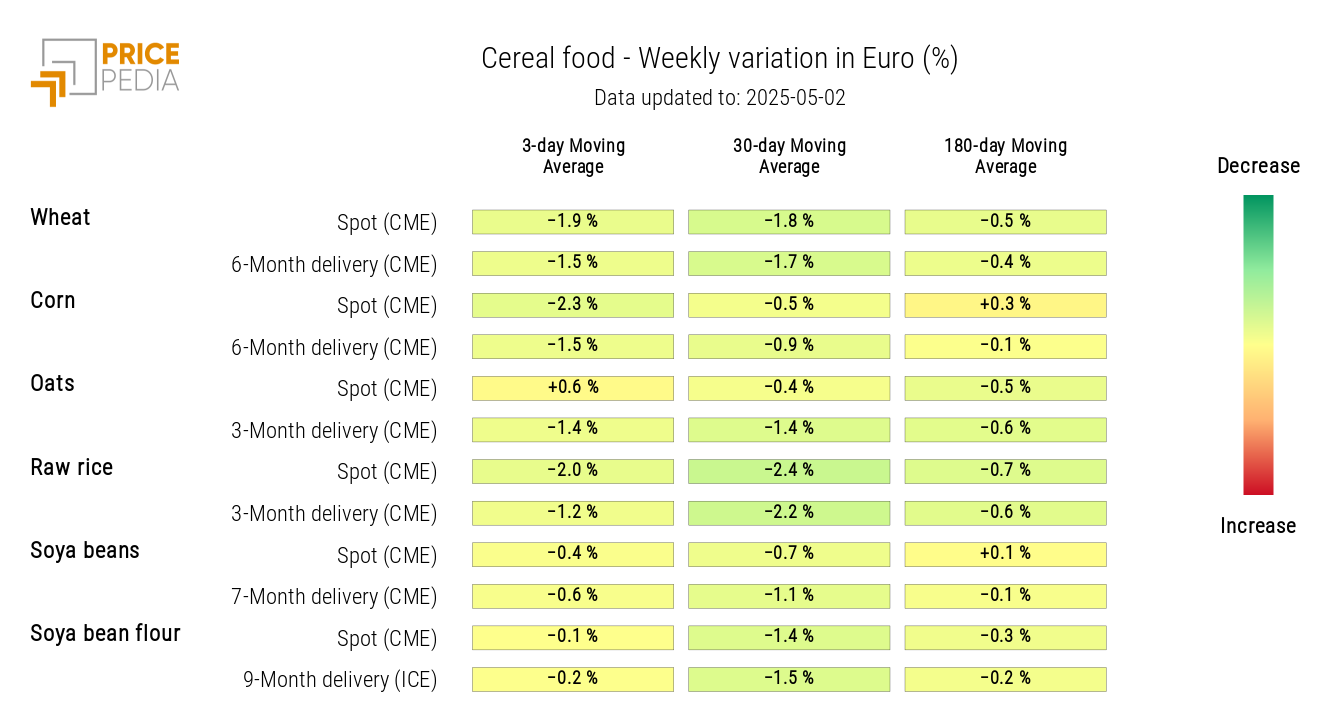
The cereals heatmap shows a decrease in the prices of wheat and corn.
HeatMap of Cereal Prices in Euro
TROPICAL PRODUCTS
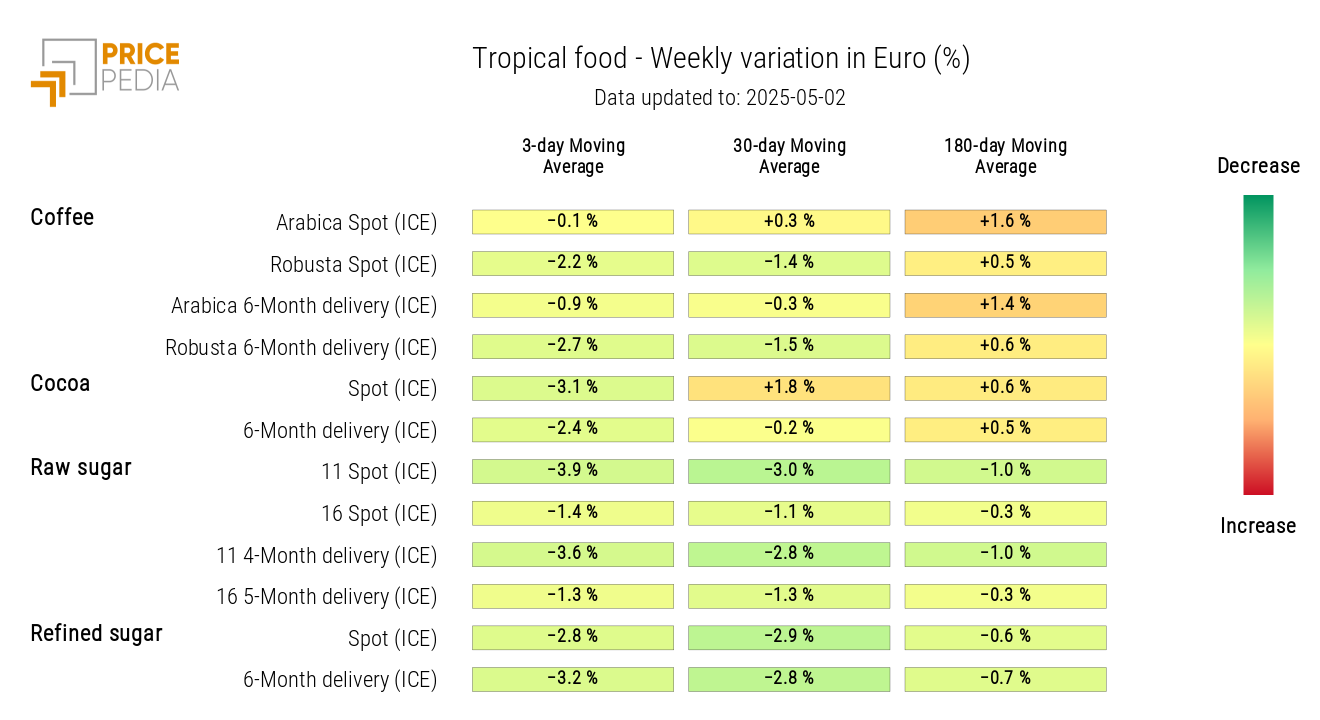
The tropical products heatmap highlights the difference in weekly price changes between arabica and robusta coffee, with the latter declining more than the former.
A decrease in cocoa prices and a drop in sugar prices are also noted, the latter due to expectations of a higher harvest in Brazil for the 2025/26 season, favored by improved weather conditions.
HeatMap of Tropical Food Prices in Euro
