Analysis of copper wire prices: the heart of the modern electrical industry
Analysis and price dynamics of the electricity industry's main production input
Published by Luca Sazzini. .
Copper Price DriversCopper wires are the fundamental pillars of the electrical industry, essential for the transmission and distribution of electricity, as well as for the operation of motors and transformers. Their production starts from refined copper rod, obtained by melting copper ingots or cathodes. The rod is then processed through drawing to reduce its diameter to the desired size.
Given the central role of copper wires in industrial processes, the trend of their prices plays a crucial role for the entire electrical supply chain. Analyzing copper wire prices becomes essential, as their dynamics influence much of the production chain, from cable manufacturing to the creation of more complex products such as electric motors.
In the article Cost pass-through along the copper derivatives supply chain, it is reported that, in the long term, the price elasticity of electric cables with respect to copper wire prices is 0.83. This means that, ceteris paribus, a 10% increase (decrease) in copper wire prices corresponds, on average, to an 8.3% increase (decrease) in electric cable prices.
The cost pass-through between refined copper wires and winding wires—copper wires specifically processed for motor windings—is estimated at 0.66, while the elasticity with respect to electric motors stands at 0.40. These elasticity levels suggest that changes in refined copper wire prices also have a significant indirect impact on prices throughout the electrical industry.
The importance of copper wires in modern industry is also reflected in the evolution of their global trade, which has seen significant growth over the past thirty years.
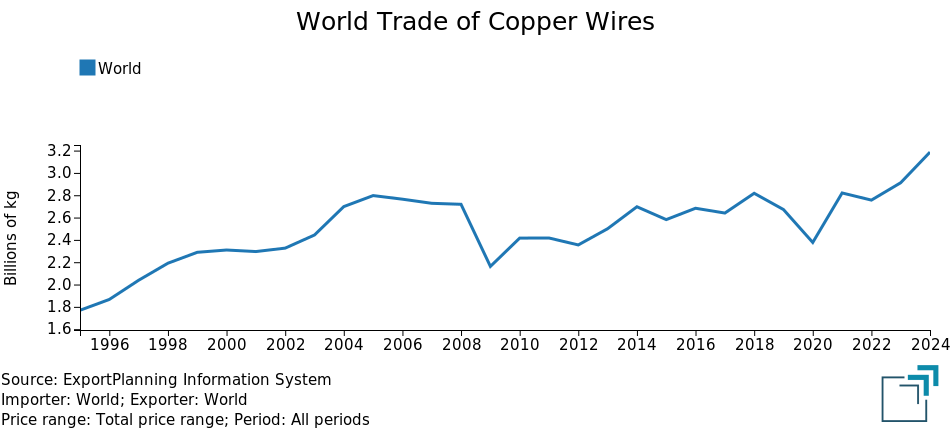
The following chart shows the global trade trend in weight of copper wires, based on data from Export Planning.
Global trade of copper wires, in billion Kg

The global copper wire trade chart clearly shows the strong growth recorded over the past thirty years. In fact, global copper wire trade grew from 1.77 million tons in 1995 to 3.19 million tons in 2024, representing an increase of over 80%.
In this article, we will analyze the prices of copper wires, including winding wires, in three main geographic areas: the European Union, the United States, and China. Subsequently, we will conduct a further analysis on electric cable prices to verify whether they have followed a similar trend to copper wires.
Analysis of copper wire prices
From a commercial perspective, it is essential to distinguish copper wires into two macro categories:
- refined copper wires: composed of high-purity copper (99.99%), used as production input for further industrial processing;
- winding copper wires: these are copper conductor wires specifically designed for use in the windings of electric motors, transformers, coils, and other electromagnetic components, where high performance is required in terms of conductivity and mechanical strength.
The following table shows the annual price trends of refined copper wires and winding copper wires, broken down by the specific types traded in the customs markets of the European Union, the United States, and China.
Table of annual average prices for refined copper wires and winding copper wires, expressed in euro/ton
| Customs prices | 2019 | 2020 | 2021 | 2022 | 2023 | 2024 | 2025 |
|---|---|---|---|---|---|---|---|
| EU Customs Prices | |||||||
| D-Last Price EU-Copper wires (cross-section ≤ 0.5 mm) | 6205 | 6181 | 8559 | 9153 | 8919 | 9340 | 9547 |
| D-Last Price EU-Copper wires (cross-section 0.5–6mm) | 5665 | 5729 | 8102 | 8550 | 8333 | 8623 | 9168 |
| D-Last Price EU-Copper wires (cross-section > 6 mm) | 5579 | 5590 | 8089 | 8526 | 8245 | 8752 | 9276 |
| D-Last Price EU-Copper wires for windings (insulated) | 6872 | 6754 | 7892 | 9327 | 9269 | 9275 | 9455 |
| D-Last Price EU-Copper wires for windings (enameled) | 6218 | 6180 | 7883 | 9088 | 9306 | 9698 | 9848 |
| USA Customs Prices | |||||||
| D-Historical USA-Copper wires (cross-section > 6 mm ≤ 9.5 mm) (USA CIF) | 5719 | 5607 | 7852 | 8970 | 8348 | 9021 | 9363 |
| D-Historical USA-Copper wires (cross-section > 9.5 mm) (USA FOB) | 5835 | 5887 | 8228 | 9056 | 8509 | 8983 | 9519 |
| China Customs Prices | |||||||
| D-Historical China-Copper wires (cross-section > 6 mm) (China CIF) | 5604 | 5453 | 7527 | 8492 | 7862 | 8388 | 8659 |
| D-Historical China-Copper wires (cross-section > 6 mm) (China FOB) | 5592 | 5491 | 7910 | 8842 | 8261 | 8693 | 8870 |
| D-Historical China-Copper wires (cross-section ≤ 6 mm) (China CIF) | 6862 | 6723 | 9300 | 10737 | 9877 | 10455 | 11379 |
| D-Historical China-Copper wires (cross-section ≤ 6 mm) (China FOB) | 6718 | 6236 | 8564 | 9883 | 8987 | 9595 | 10255 |
The analysis of the table reveals a significant increase in copper wire prices in recent years. From 2019 to today, copper wire prices have increased on average by about 3000–4000 euros/ton, with an overall growth of 58%.
The price levels appear relatively homogeneous, with slight discrepancies attributable to the local reference market and, above all, to the specific type of wire considered. Taking copper wires with a section greater than 6 mm as an example, slightly higher prices are observed in the United States compared to those in the European Union, and even more so compared to Chinese prices.
On average, wires with smaller cross-sections tend to carry a premium over those with larger sections, due to higher production costs associated with the greater number of drawing steps. This is particularly evident in the Chinese market, with price differences that can exceed 2000 euros/ton depending on the section size.
Focusing on the European market, the premium of winding wires over refined copper wires has gradually decreased in recent years, reaching very similar price levels.
Do you want to stay up-to-date on commodity market trends?
Sign up for PricePedia newsletter: it's free!
Analysis of Electric Cable Prices
After analyzing the price trends of copper wires, it may also be interesting to examine the trends in electric cable prices to see whether they have followed a similar pattern in recent years.
The following table shows the annual trend of EU customs prices for electric cables, expressed in euros per ton.
Table of average annual prices of electric cables, expressed in euros per ton
| 2019 | 2020 | 2021 | 2022 | 2023 | 2024 | 2025 | |
|---|---|---|---|---|---|---|---|
| D-Last Price EU-Electric cables (volt. < 80V) | 6179 | 6180 | 7571 | 8437 | 8824 | 9260 | 9228 |
| D-Last Price EU-Electric cables (volt. ≥ 80V < 1000V) | 4834 | 4673 | 6209 | 7340 | 7313 | 7180 | 7453 |
| D-Last Price EU-Electric cables (volt. = 1000V) | 3922 | 3805 | 5094 | 6420 | 6641 | 6567 | 6644 |
| D-Last Price EU-Copper electric cables (volt. > 1000V) | 5936 | 5514 | 6758 | 7443 | 7750 | 8134 | 7838 |
From the table analysis, we see that electric cable price trends are consistent with those of copper wires. Current electric cable prices are significantly higher than pre-pandemic levels, with an average increase of about 50% compared to 2019.
Overall, the price that saw the largest increase was that of electric cables with a voltage of 1000 volts, which rose from under 4,000 euros/ton in 2019 to 6,600 euros/ton in 2025.
Conclusions
Copper wires are a fundamental input for the entire contemporary electrical industry. Over the last thirty years, global trade in copper wires has grown by over 80%, reaching a volume of 3.2 million tons in 2024.
Refined copper wire prices follow a common global trend, primarily influenced by copper prices, with which they show a long-term elasticity of 0.84. However, there are slight differences between regional markets and depending on the specific product characteristics. In particular, prices on the American market tend to be slightly higher than those in Europe and China. The true price differentiator, however, is the wire's cross-sectional size, with smaller-section wires generally costing more due to the higher number of passes required in the drawing dies.
The analysis of electric cable prices reveals a trend relatively similar to that of copper wires, also characterized by a strong increase compared to pre-pandemic levels. From 2019 to today, electric cable prices have increased on average by about 50%.


