Liberation or Ruination Day? A storm of tariffs on commodity markets
Financial markets fail U.S. protectionist policy
Published by Luca Sazzini. .
Conjunctural Indicators Commodities Financial Week
On April 2, 2025, the Trump administration signed the executive order titled "Regulating Imports with a Reciprocal Tariff to Rectify Trade Practices that Contribute to Large and Persistent Annual United States Goods Trade Deficits”. The provision introduces a base tariff of 10% on all imports into the United States, effective April 5, 2025.
For about 60 countries, the order imposes additional tariffs, effective April 9, 2025. For the EU, the total rate is 20%.
Some sectors are excluded from the new tariffs. In particular:
- Steel and aluminum, already subject to separate 25% tariffs since March 12, 2025, are not covered by this order.
- An annex, the so-called Annex II, has also been published, listing over 1,000 exempt products. These include pharmaceuticals, lumber, semiconductors, copper, and many chemical products.
Another exception concerns automotive industry products: the US government has imposed a specific 25% tariff on these, already in effect since April 3, 2025, regardless of the country of origin.
Many analysts and economists have criticized the measure, arguing that it will harm global trade as a whole, unfairly penalizing competitive countries with trade surpluses against the United States. Furthermore, the tariffs introduced by the Trump administration will not only burden foreign exporters: part of the cost will also fall on US businesses and consumers, leading to higher domestic prices in the US.
Expectations of rising inflation in the United States, as a result of Trump’s latest trade maneuver, had a strong impact on the value of the dollar, which saw a significant depreciation on Thursday.
The following chart shows the trend in the exchange rate between the euro and the US dollar.
Exchange rate between the euro and the US dollar

Normally, a protectionist policy tends to strengthen the national currency, but in this case, fears of accelerating inflation had the opposite effect, weakening the US dollar.
This scenario makes any potential intervention by the Federal Reserve even more complicated. Should it decide to support the economy by cutting interest rates, it risks further fueling inflationary pressures.
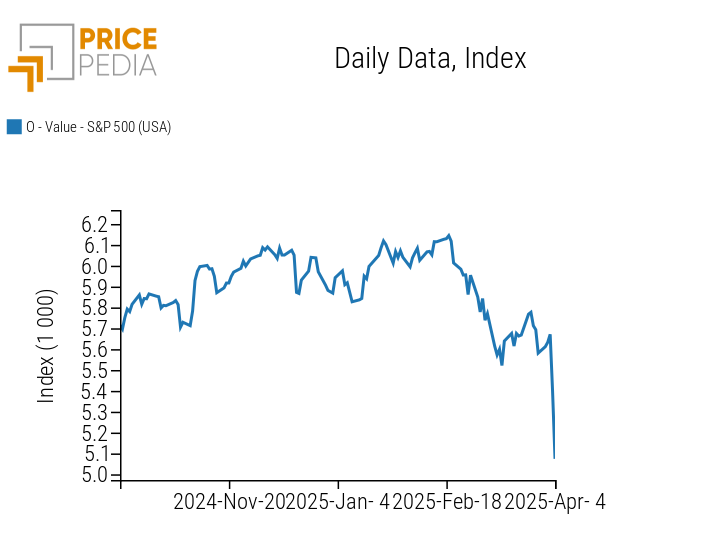
Although the US economy remains strong, several analysts report a significant increase in the risk of recession due to growing distrust among consumers and investors. These concerns were reflected in the financial markets, with the S&P 500 index experiencing a cumulative drop of over 10% on Thursday and Friday.
The following chart shows the performance of the S&P 500 stock index, considered the main benchmark of the US stock market.
Historical series of the S&P 500
Weekly Summary of Financial Commodity Prices
Fears of a global growth slowdown affected not only US stock markets but also global commodity markets. Even gold, the ultimate safe-haven asset, saw a price decline following President Trump’s protectionist measures.
The sharpest contractions were observed in the energy and non-ferrous metals markets.
In the last two days of the week, Brent crude fell to $65.6/barrel, losing nearly $10 from the $75/barrel price on Wednesday. This drop was due to a combination of factors: concerns about US trade policy and OPEC+'s announcement of a larger-than-expected increase in oil supply.
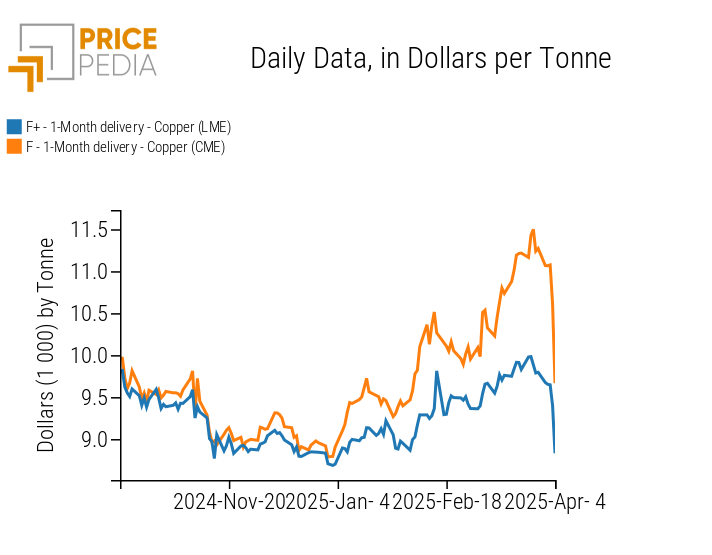
In the non-ferrous metals market, there was a general price decline tied to concerns over a possible lack of recovery in Chinese demand, due to US tariffs. The United States has announced a 34% tariff on Chinese imports. This measure could slow down China’s economic growth, limiting the recovery in Chinese demand for non-ferrous metals. In particular, these fears mainly impacted copper prices, which plummeted after the tariff announcement. In two days, copper prices fell by 8.5% on the London Metal Exchange (LME) and by 19.2% on the Chicago Mercantile Exchange (CME). The greater drop in copper prices on the US market is due to the exemption of copper imports from Thursday's tariffs.
Below are the financial prices of copper listed on the London and Chicago exchanges.
Financial copper prices, expressed in $/ton
In the ferrous metals market, the negative impact of the new US tariffs was partially offset by the depreciation of the US dollar. Unlike non-ferrous metals, ferrous metals tend to show greater price stability and less sensitivity to market shocks.
NUMERICAL APPENDIX
ENERGY
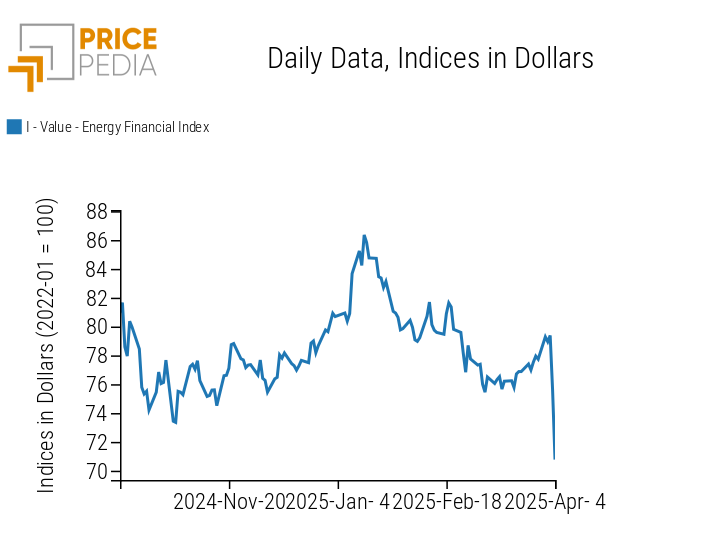
The analysis of the PricePedia energy products index highlights the price drop following the tariffs announced by Trump.
PricePedia Financial Index of Energy Prices in dollars
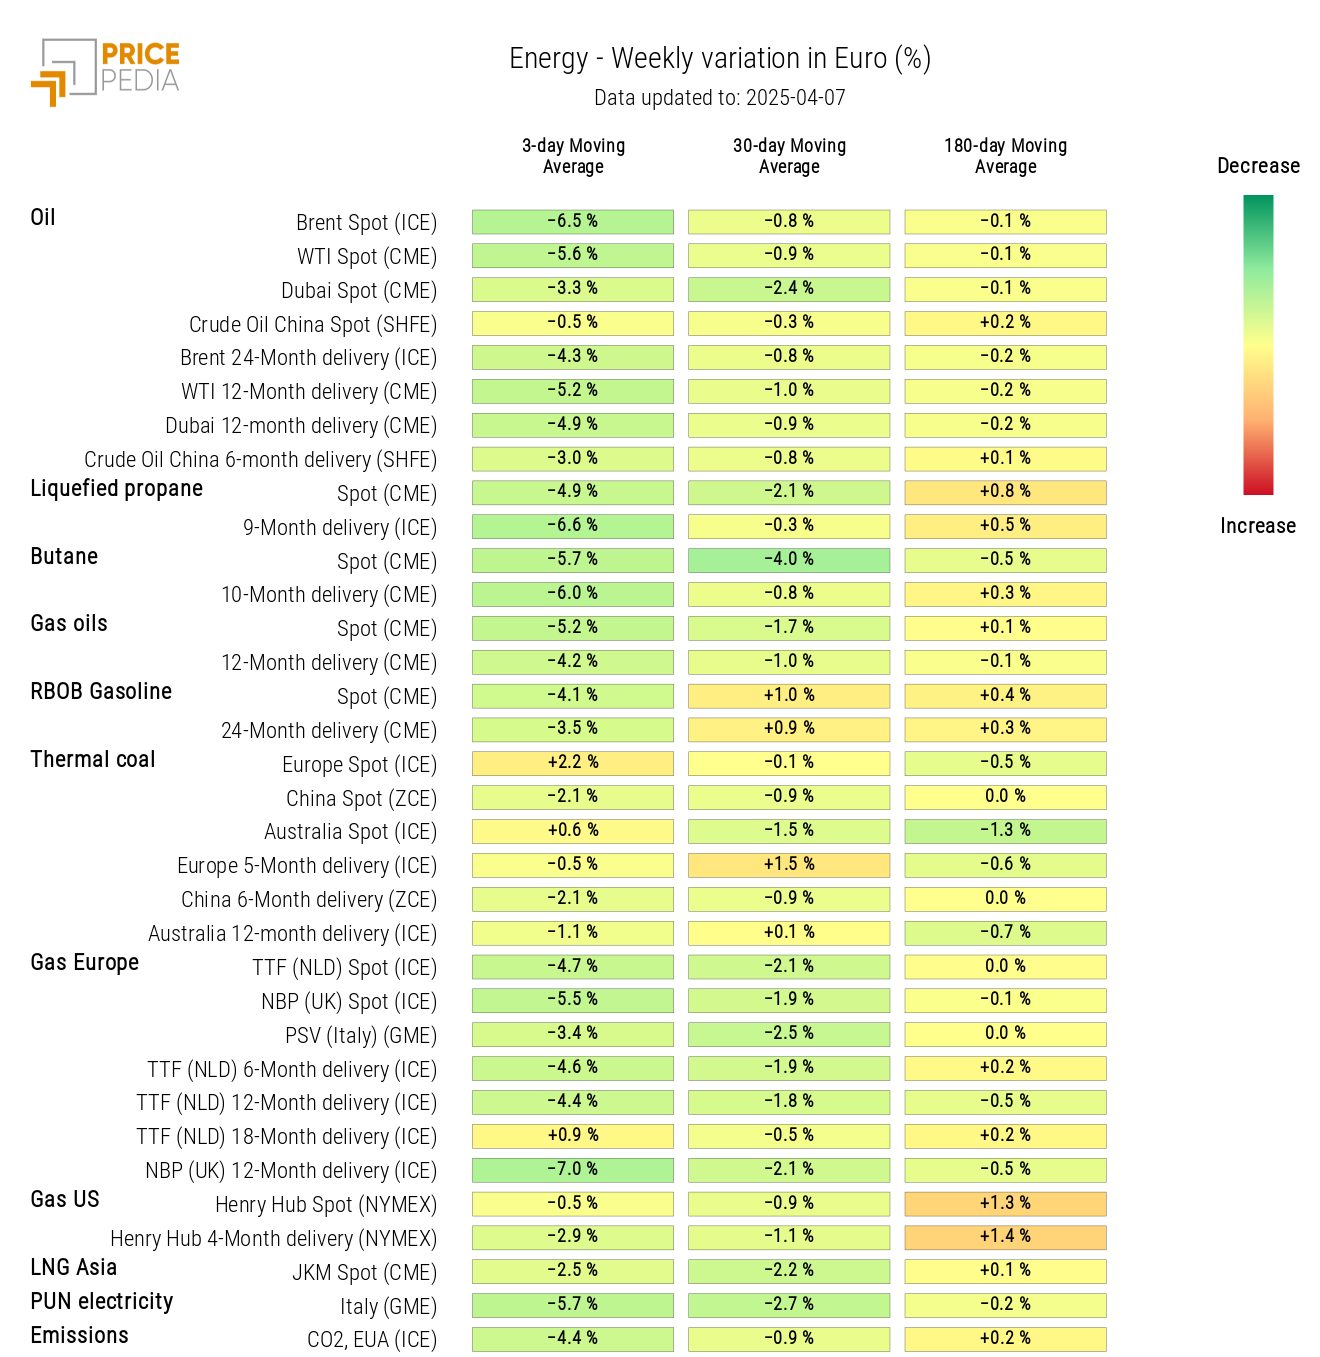
The PricePedia energy heatmap highlights the strong weekly decrease in the 3-day moving average of oil and most energy products, with the exception of thermal coal.
HeatMap of energy prices in euros
PLASTICS
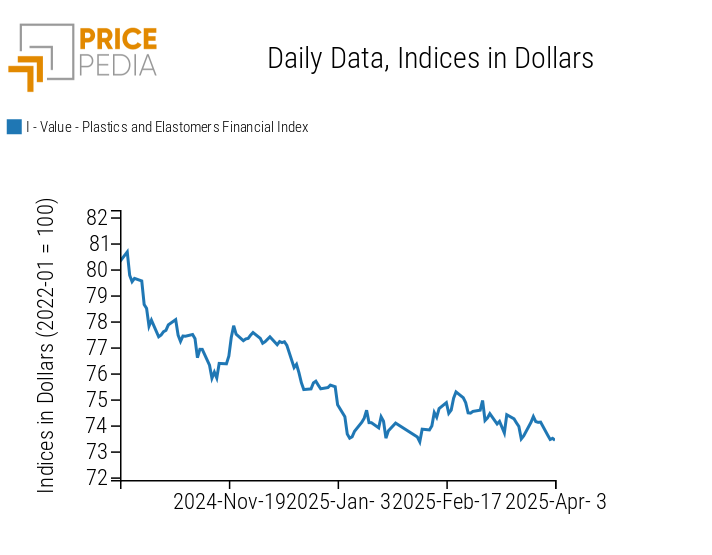
The financial index of Chinese plastics and elastomers followed a weekly trend of price decline.
The index is updated as of Thursday, April 4, due to the closure of Chinese financial markets for the Qingming Festival.
PricePedia Financial Indices of Plastics Prices in dollars
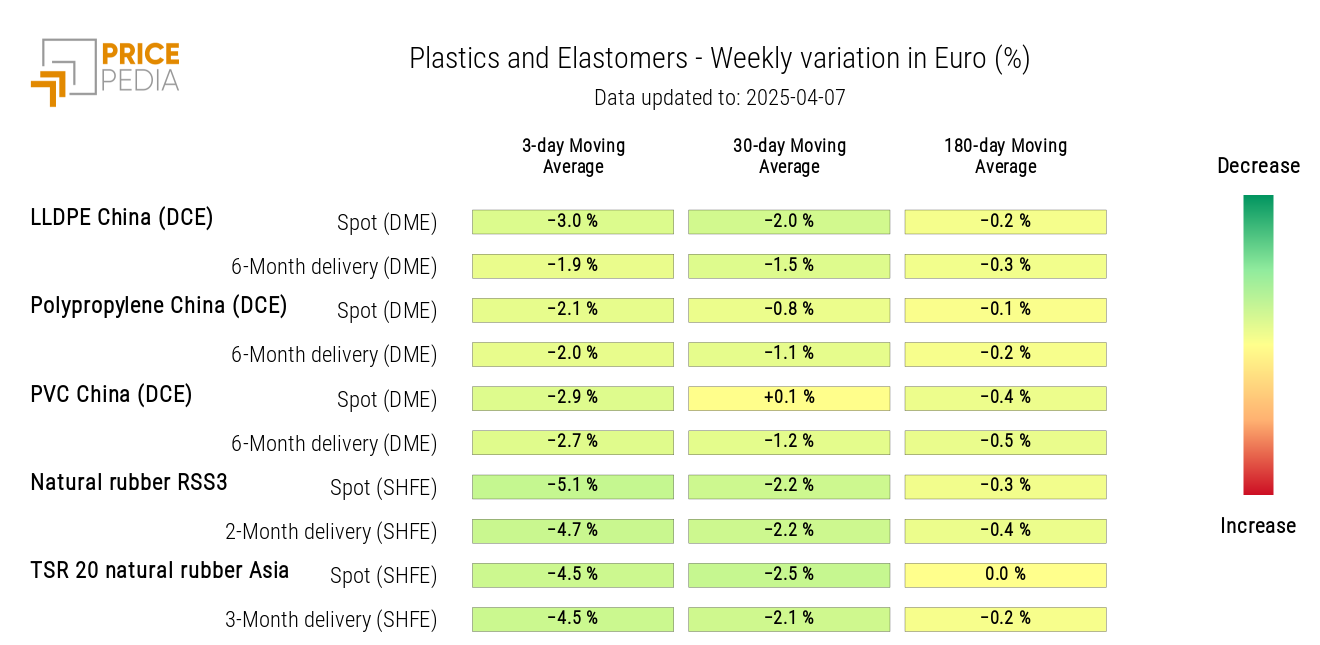
The heatmap analysis shows a price decline across all products in the index, particularly for elastomers.
HeatMap of plastics and elastomers prices in euros
FERROUS
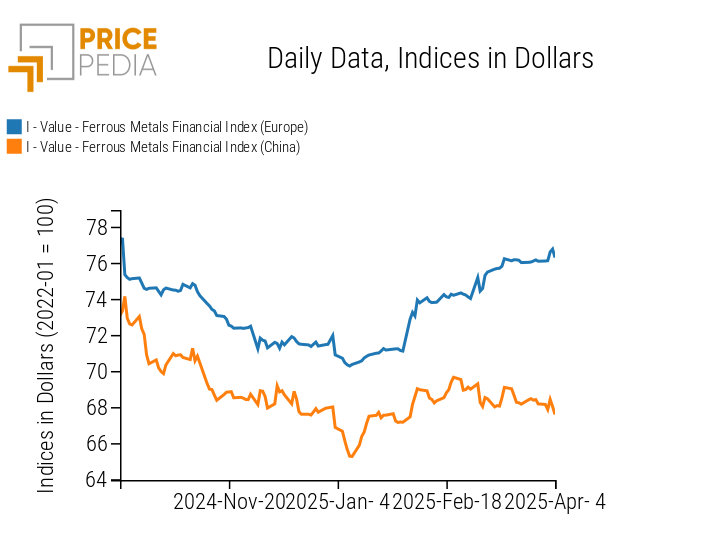
The financial index of ferrous metals on the Chinese market remains relatively stable, while the European one experiences a slight increase caused by the rise in dollar prices of LME ferrous metals, due to the depreciation of the US dollar.
PricePedia Financial Indices of Ferrous Metal Prices in dollars
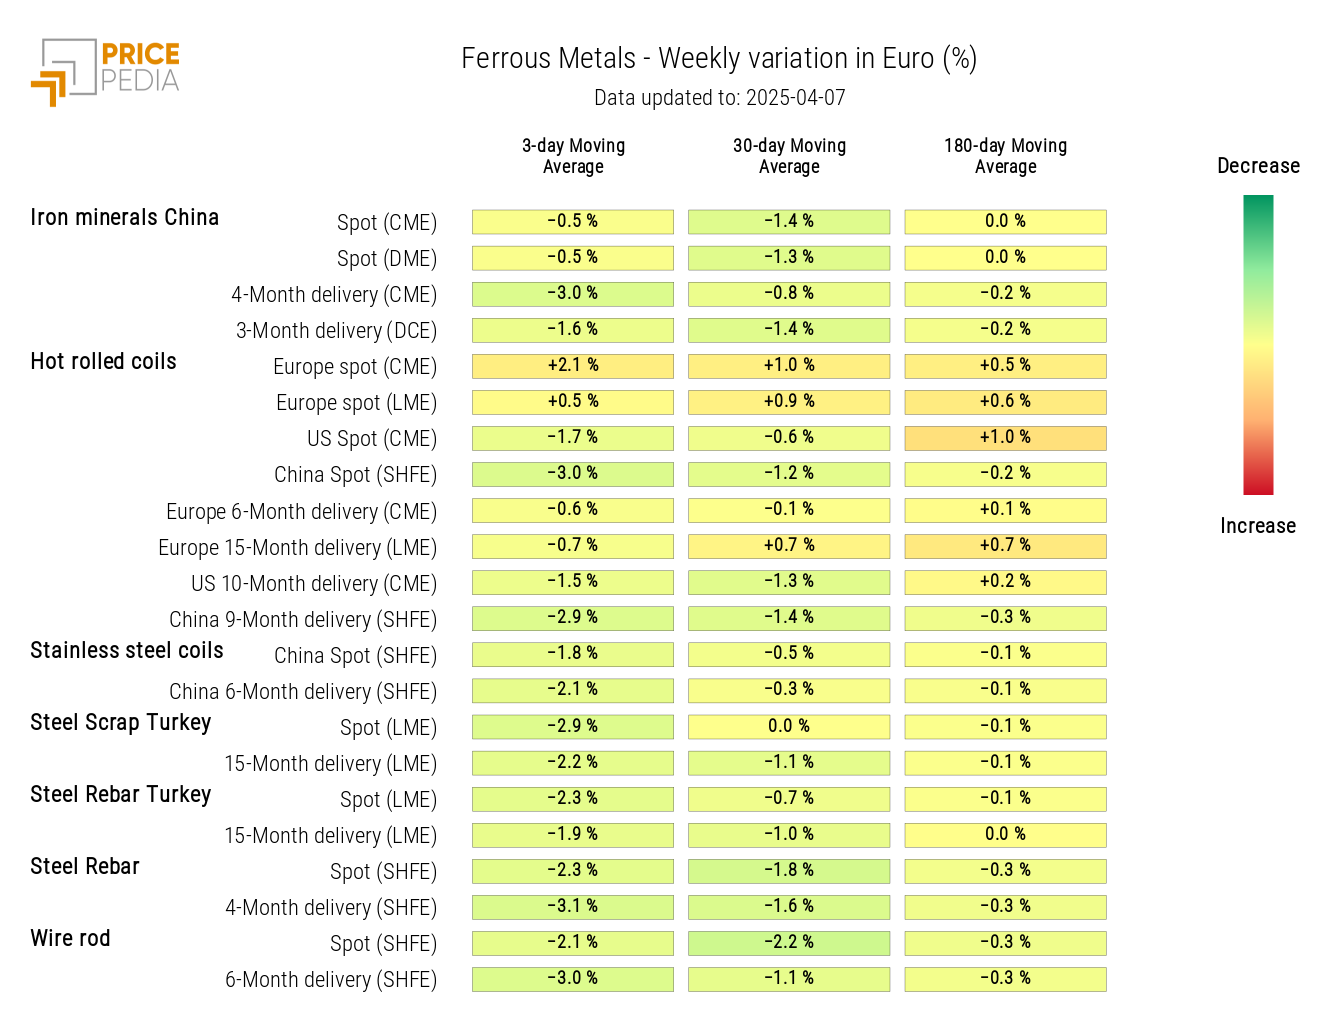
The analysis of the heatmap expressed in euros shows a slight overall decrease in ferrous metal prices, with the exception of hot-rolled coils in Northern Europe.
HeatMap of Ferrous Prices in euros
Do you want to stay up-to-date on commodity market trends?
Sign up for PricePedia newsletter: it's free!
NON-FERROUS INDUSTRIAL
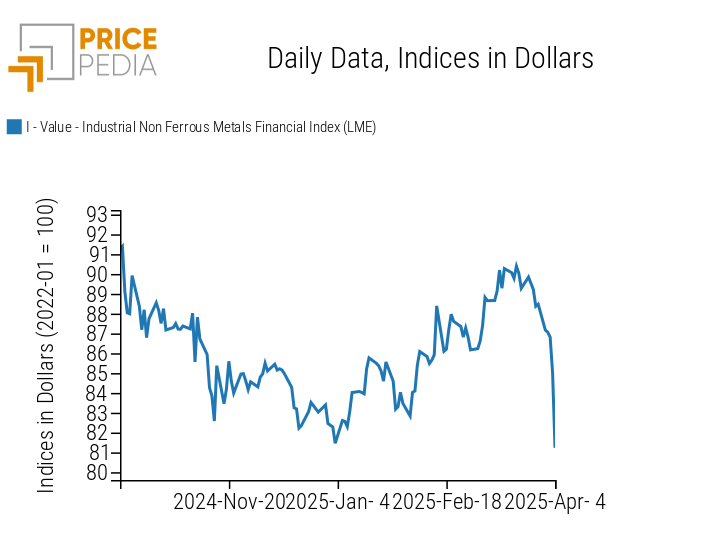
The financial price index of non-ferrous metals shows a sharp decline, due to concerns about global economic growth triggered by Trump’s tariffs.
PricePedia Financial Index of LME Industrial Non-Ferrous Metal Prices in dollars
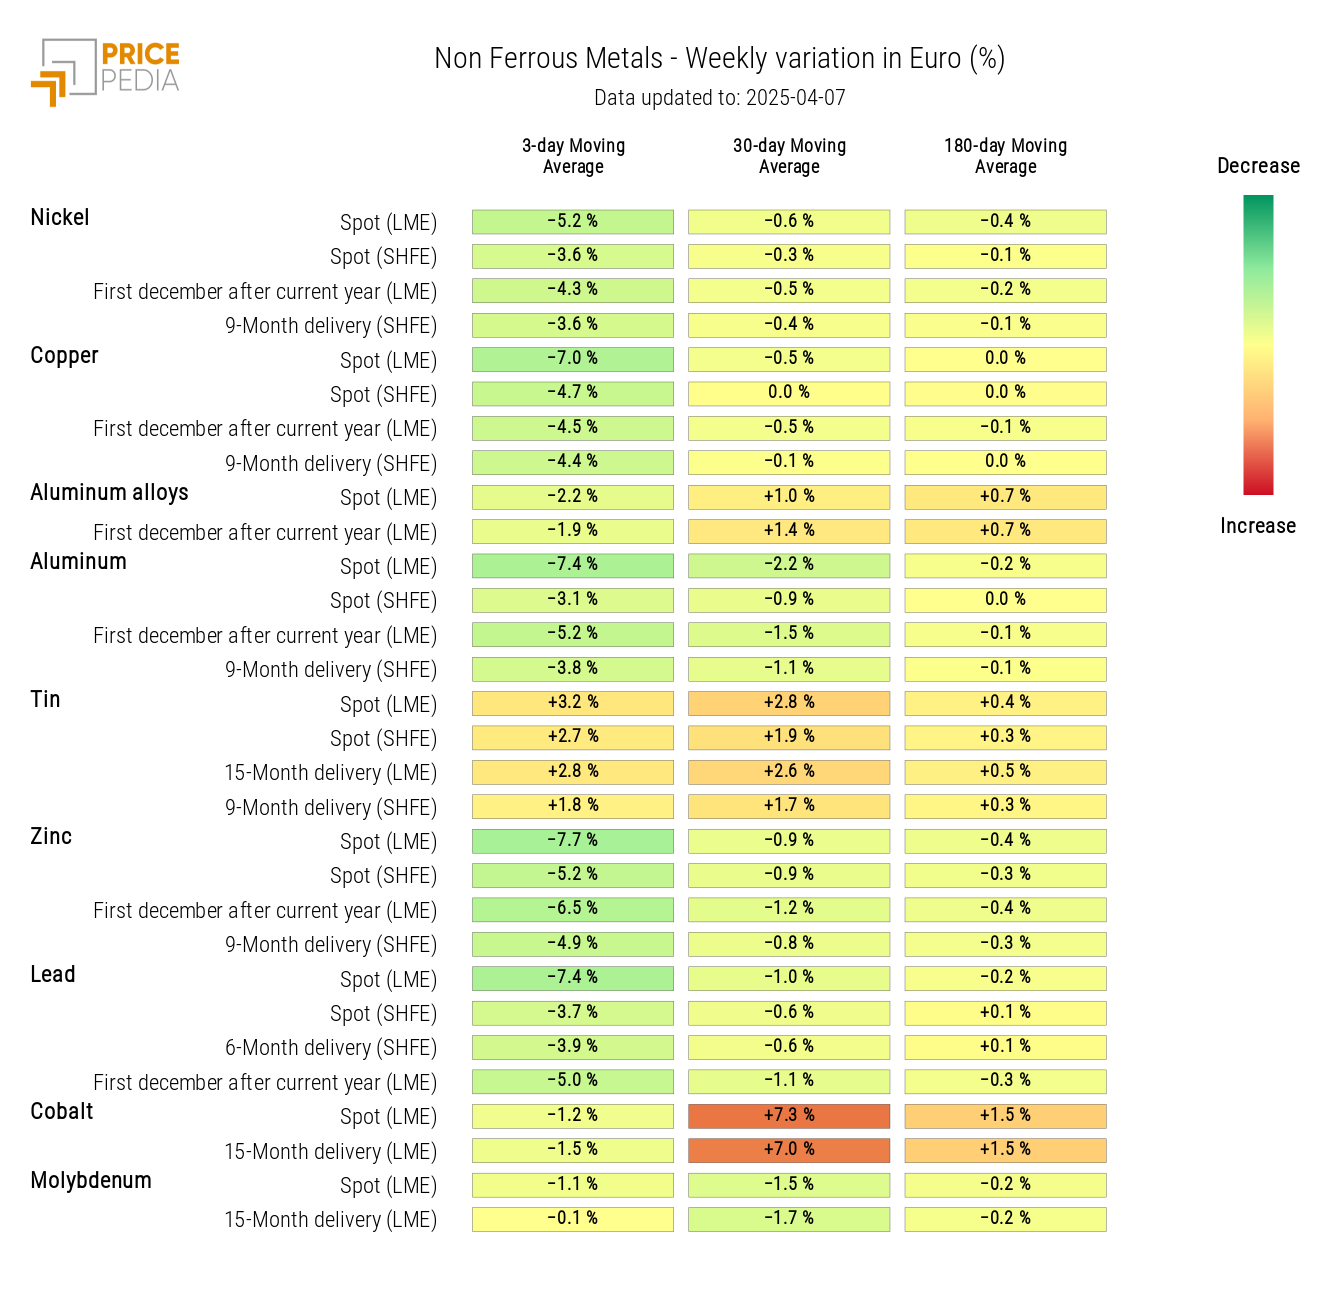
The non-ferrous heatmap turns green, except for tin prices, which show a positive weekly change in the three-term moving average.
HeatMap of Non-Ferrous Prices in euros
FOOD
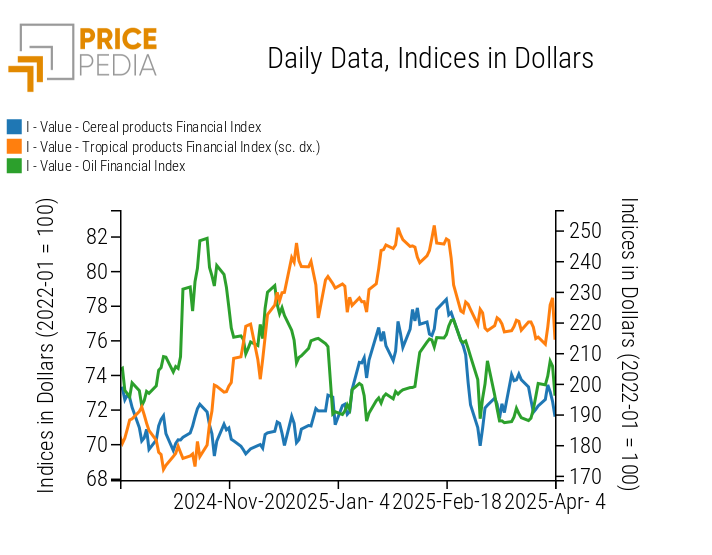
Food product indices experienced strong and contrasting fluctuations throughout the week. Overall, the cereal index is decreasing, while the oil index is rising.
PricePedia Financial Indices of Food Prices in dollars
CEREALS
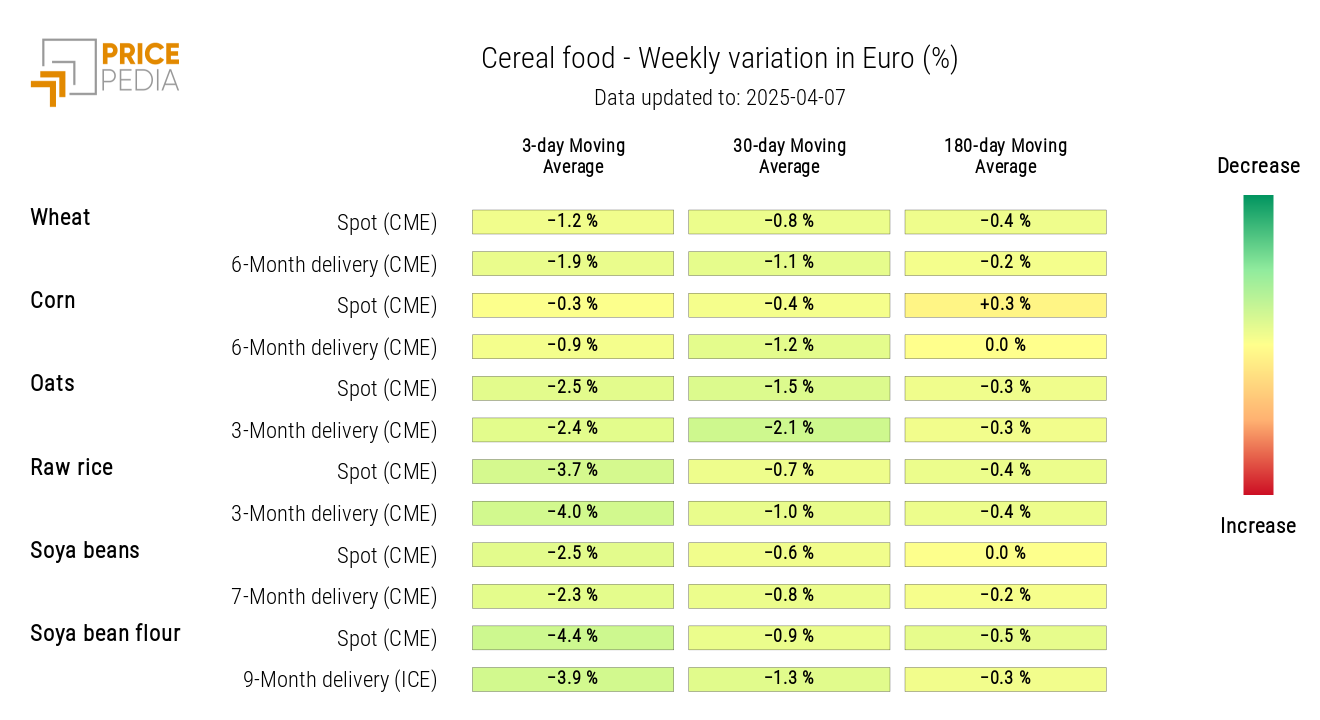
The cereal heatmap shows a general decrease in the three-day weekly moving average of prices.
HeatMap of Cereal Prices in euros
TROPICAL
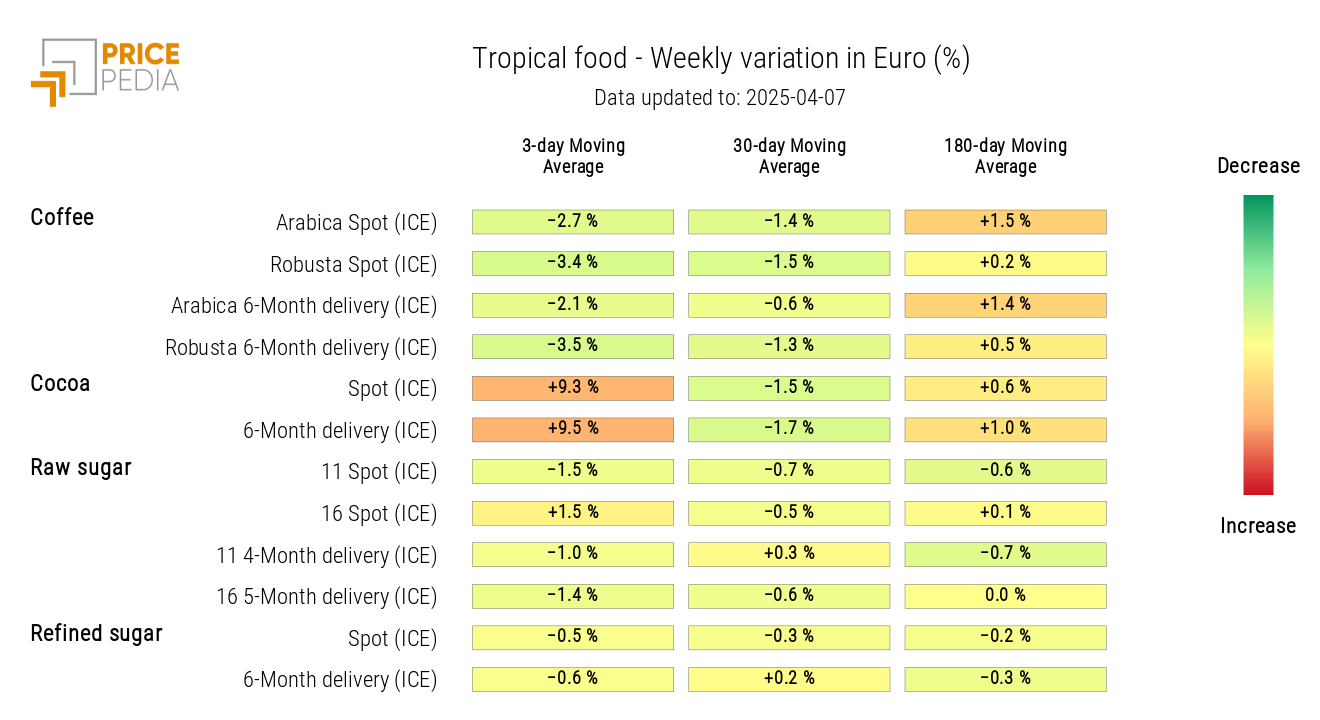
The tropical heatmap highlights the sharp increase in financial prices of cocoa. The rise in cocoa prices, in addition to reflecting the effect of a weaker dollar, is mainly attributed to growing concerns about unfavorable weather conditions that have affected the harvest in Ivory Coast, the world's leading producer.
In contrast, coffee prices have seen a sharp decline.
HeatMap of Tropical Food Prices in euros
OILS
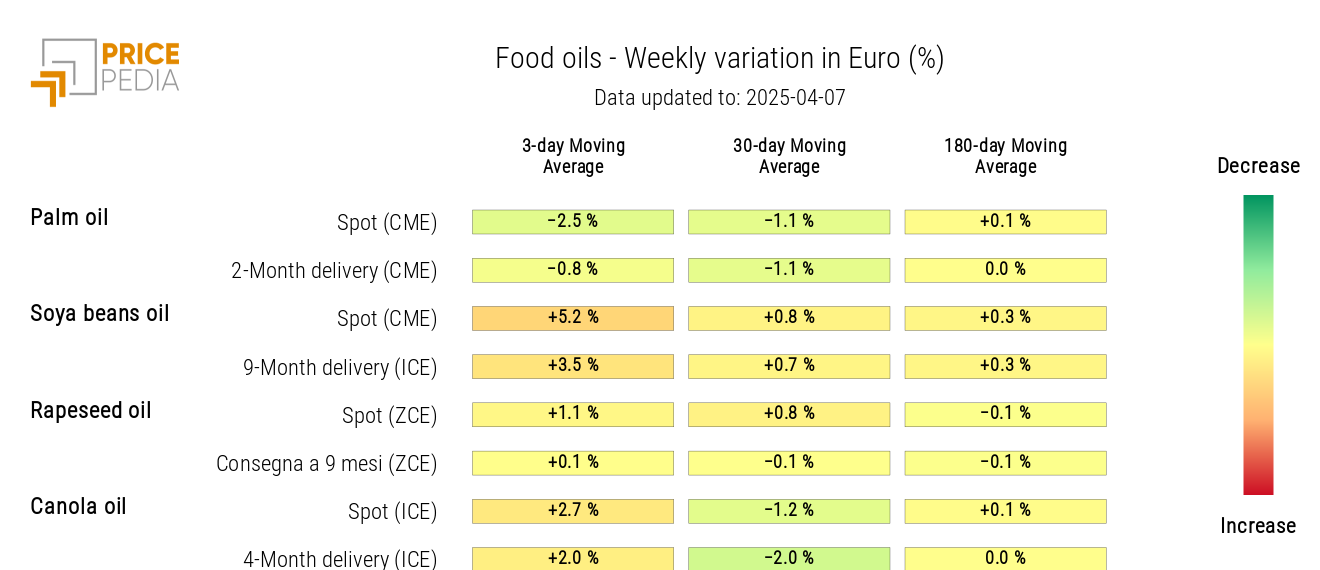
The heatmap of edible oils shows a weekly increase in the moving average of soybean oil and canola oil.
HeatMap of Edible Oil Prices in euros
