Price gap between the European and Chinese markets
Analysis of regional price differences using PricePedia aggregate indices
Published by Luca Sazzini. .
Conjunctural Indicators Price DriversIn July 2024, the PricePedia database expanded with the addition of the new China Customs[1] section, announced in the following article:
“PricePedia broadens its database: China Customs prices now available”.
This database expansion allows for immediate comparisons between prices recorded in the European customs market and those in the Chinese customs market.
From the analysis of these comparisons, a particularly interesting dynamic emerged for the aggregate industrial commodities index, an index consisting of the total commodities excluding energy and food. Specifically, this index aggregates the following categories: Ferrous, Non-Ferrous, Wood and Paper, Chemicals (specialty, organic, and inorganic), Plastics and Elastomers, and Textile Fibers.
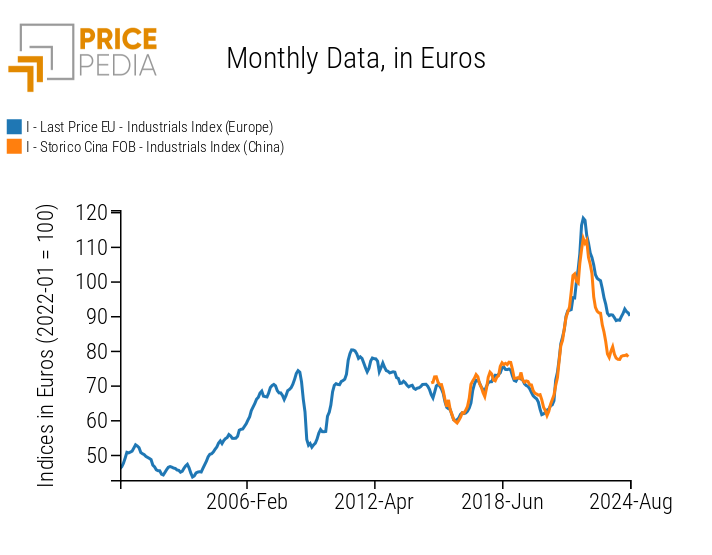
The graph below shows the comparison between the industrial commodities index of the European market and that of the Chinese market, both expressed in euros and based at 100 in January 2022.
Comparison between the industrial commodities indices of the European and Chinese markets

From the graphical comparison, it is evident that the industrial commodities index followed very similar dynamics in both the EU and China for almost a decade. Until 2022, the two industrial indices were nearly overlapping, indicating a close integration between the commodities markets of the two regions. However, in the most recent period, a divergence in the intensity of the two indices' dynamics has emerged: during the first phase of price increases, the Chinese index recorded smaller increases, while in the subsequent phase of decline, the Chinese industrial market showed a much sharper decrease compared to the European market.
By observing the cumulative variations starting from January 2022 (the year chosen as the base with value = 100), a significant difference between the two indices emerges: the Chinese index decreased by 22% in euros, while the European index saw a more contained contraction of 9%.
Do you want to stay up-to-date on commodity market trends?
Sign up for PricePedia newsletter: it's free!
To better understand this divergence, an analysis at the commodity family level may be useful to examine which families have shown more divergent variation rates.
The following table shows the variation rates from January 2020 to July 2024 for all commodity families included in the industrial index, with the addition of energy and food.
| Variation rates of commodity families from January 2022 to July 2024 | |||
| China | EU | China Position | |
| Energy: | -28% | -4% | Net importer |
| Food: | 12% | 9% | Net importer |
| Industrial: | -22% | -9% | Net exporter |
| Of which: | |||
| Ferrous: | -31% | -15% | Net exporter |
| Non-Ferrous | -6% | -4% | Net exporter |
| Plastics and Elastomers | -25% | -15% | Net exporter |
| Organic Chemicals: | -30% | -12% | Net exporter |
| Inorganic Chemicals: | -25% | 1% | Net exporter |
| Specialty Chemicals: | -28% | -6% | Net exporter |
| Textile Fibers: | -5% | -9% | Net importer |
| Wood and Paper | -3% | -1% | Net importer |
From the analysis of the table, some divergences between the variation rates of the Chinese and European indices emerge.
In particular, the former have shown much sharper price reductions than the latter for the majority of families, while for others they were relatively similar.
It is interesting to note that in all families where China plays a significant role as an exporter, Chinese prices have fallen much more than in Europe, with the exception of non-ferrous prices. The non-ferrous market is, in fact, interconnected globally due to financial markets, which, through arbitrage operations, tend to equalize prices between the two financial areas.
On the contrary, in categories where China is a net importer,[2] price dynamics have been more similar between China and Europe. This is consistent with the fact that if both China and Europe are net importers of a given product, the presence of a free global market tends to produce relatively similar import prices between the different import areas.
What explains the price gap between the European and Chinese markets?
The explanation for the price reduction in China, greater than that in the EU for products where China is a net exporter, lies in the different demand dynamics in China and Europe, not so much in absolute terms as in relation to expectations.
The demand for commodities in China was expected to grow at higher rates than those realized in recent years, leading to an excess supply in the Chinese market and a progressive shift of the excess supply from the domestic market to foreign markets.
Conclusion
The industrial commodities index in the European customs market and the Chinese market showed almost identical trends for nearly a decade, but in the most recent period, divergences between the two regional markets have intensified.
The Chinese index recorded price reductions more than twice those registered in Europe for industrial commodities.
The main reasons for these divergences between the two indices lie in the differences in demand and supply dynamics in the two regional markets.
The Chinese market is characterized by weaker-than-expected demand, and therefore an excess supply. This has led to lower internal prices compared to those observed in European customs exchanges.
[1] The section is available in the Price Data area.
[2] The case of energy is an exception to what is reported in the text.
In this family, China is a net importer, yet it records a much sharper variation rate (-28%) compared to Europe (-4%).


