Uncertain dynamics of commodity prices
Demand-side uncertainty dampens speculative actions aimed at anticipating future commodity price increases
Published by Luca Sazzini. .
Conjunctural Indicators Commodities Financial WeekUS GDP Slows Down While Inflation Rises
The latest data regarding the quarterly growth of US GDP recorded an annual growth rate of 1.6% y/y in the first quarter of 2024, less than half compared to the growth rate in the last quarter of 2023 (3.4% y/y). This slowdown in the US GDP has significantly surprised analysts' expectations, who predicted GDP growth between 2.4% and 2.5% y/y.
Despite this unexpected slowdown in the US economy, analysts' focus has shifted predominantly to data concerning US inflation in the first quarter of 2024. The core PCE index reported an inflation rate of 3.7% y/y, higher than analysts' forecasts of 3.4%. This data is the most concerning for financial markets as it is well above the 2% target set by the Federal Reserve (FED). The main concern is the possibility of restrictive monetary policies by the FED to counter the high inflation persisting well above the target set by the Central Bank.
Flash PMI Estimates
This week, new flash estimates regarding the PMI data of the United States and Europe for April 2024 have been released. Both composite PMIs have signaled growth in their respective economies, recording values above the 50-point threshold, which represents the dividing line between economic growth and contraction.
The eurozone's composite PMI stood at a value of 51.4 points, an increase from March's figure of 50.3. Conversely, the US composite PMI has deteriorated in April, dropping from a value of 51.1 to 50.9.
Despite both composite PMIs being positive, as they still record values above 50 points, weaknesses are observed in the manufacturing sector for both Western economies. The US manufacturing PMI returns to a value below 50 points, decreasing from 51.9, recorded in March, to a value of 49.9 for April. In the eurozone, on the other hand, the crisis in the manufacturing sector intensifies, signaling a further deterioration of the manufacturing PMI estimated at 45.6 for April.
Overall, although the data on composite PMIs remains positive, flash estimates confirm a slowdown in economic growth in the US economy and a worsening of the manufacturing sector for both economies, especially the European one, which has long been characterized by decline in this sector.
Commodity Market Trends
Despite the current geopolitical crisis, prices of oil and other energy commodities continue to remain relatively stable, avoiding significant positive fluctuations. The main reason hindering rises due to possible crises in the Middle East is related to the fundamentals of the oil and gas markets, which currently remain both bearish.
The industrial metals market begins to slow its recent growth, with ferrous prices remaining mostly stable this week, and non-ferrous prices starting to show weak downward oscillations within their upward price trend.
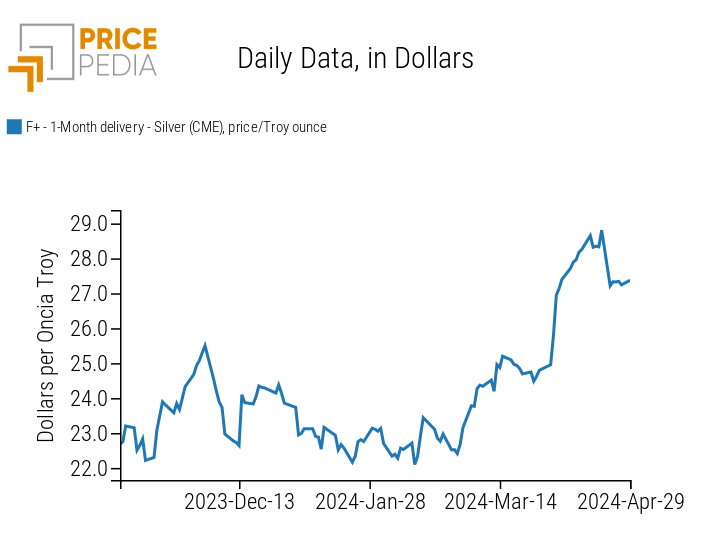
Prices of precious metals such as gold and silver also show a decline, interrupting for the first time the continuous rise that has guided them over the past two months. The persistence of US inflation has completely undermined confidence in an imminent rate cut by the Federal Reserve, favoring the halt of growth for the two metals.
Below is the trend of spot prices for gold and silver over the past 6 months, both quoted on the Chicago Mercantile Exchange (CME).
| Spot Price of Gold quoted on the Chicago Mercantile Exchange (CME) | Spot Price of Silver quoted on the Chicago Mercantile Exchange (CME) |

|
|
ENERGY
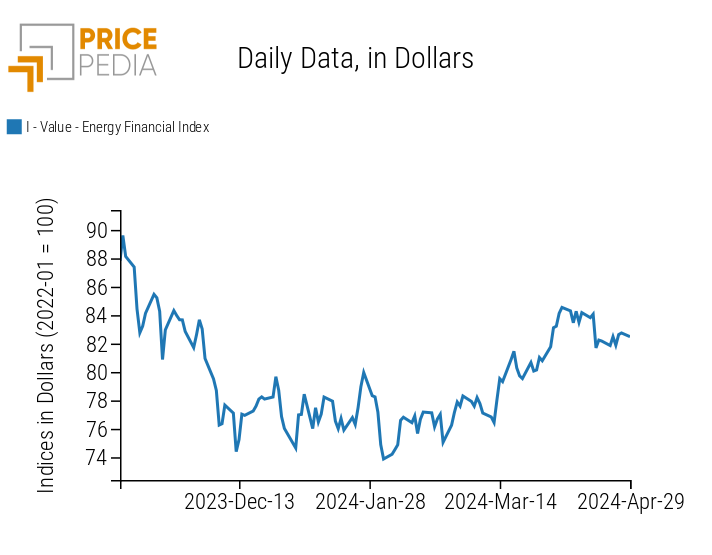
This week, the financial index of energy prices has recorded mostly sideways price changes.
PricePedia Financial Index of energy prices in dollars
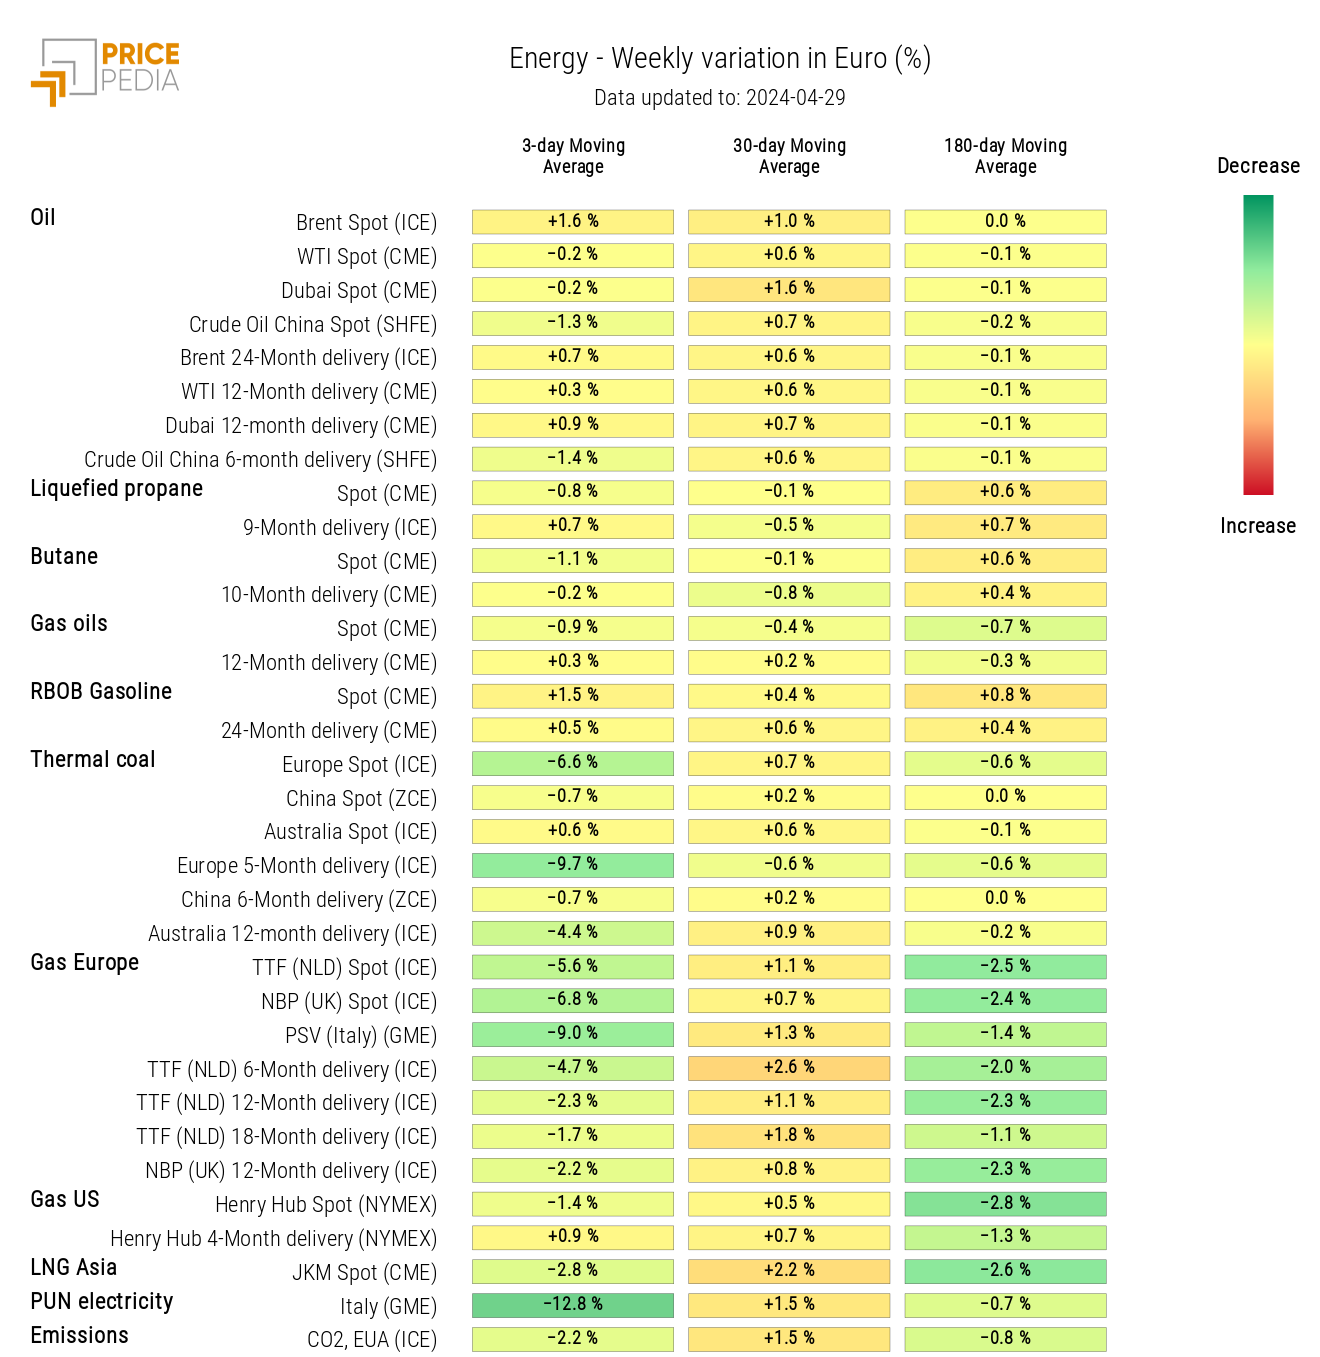
From the energy price heatmap, a decline in prices of European natural gas TTF (Netherlands) is evident, compared to the slight increases recorded last week.
Energy prices heatmap in euros
PLASTICS
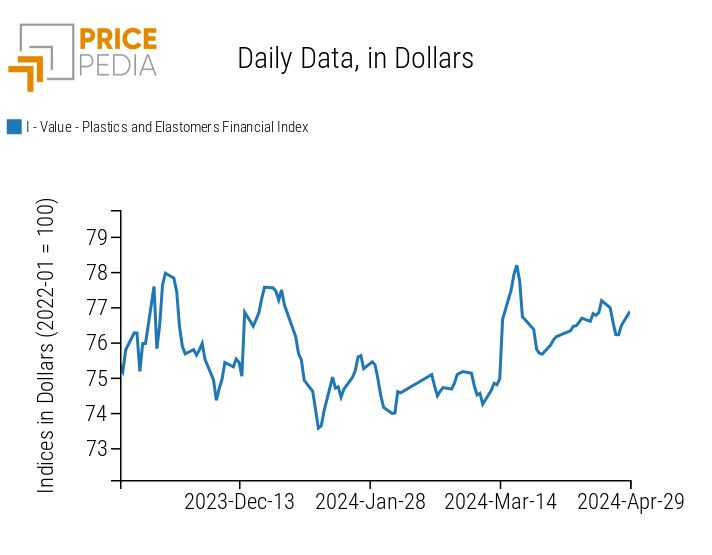
The financial index of plastics and elastomers quoted in China undergoes an oscillation that doesn't alter the price level.
PricePedia Financial Indices of plastics prices in dollars
FERROUS
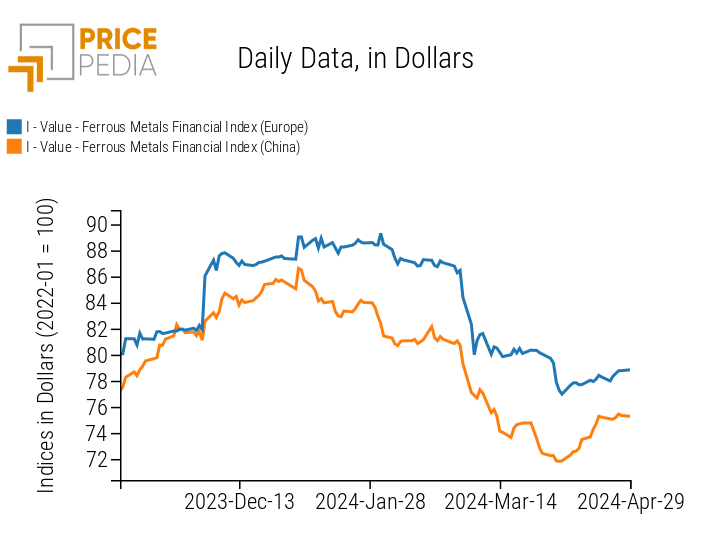
This week, both ferrous metal indices registered a weak oscillation, concluding the week with a slight positive variation.
PricePedia Financial Indices of ferrous metals prices in dollars
Do you want to stay up-to-date on commodity market trends?
Sign up for PricePedia newsletter: it's free!
NON-FERROUS INDUSTRIAL
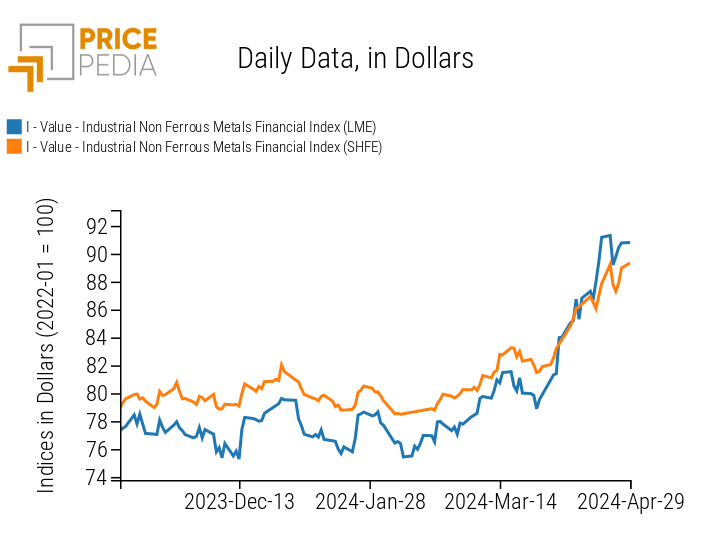
Following the significant increases in non-ferrous metals prices recorded last week, driven by the ban on Western financial markets to deliver Russian metals produced after April 12, weak downward oscillations have been observed within their upward trend. Both indices, however, conclude the week with a new rise that partially recovers the fall recorded in the previous days.
PricePedia Financial Indices of industrial non-ferrous metals prices in dollars
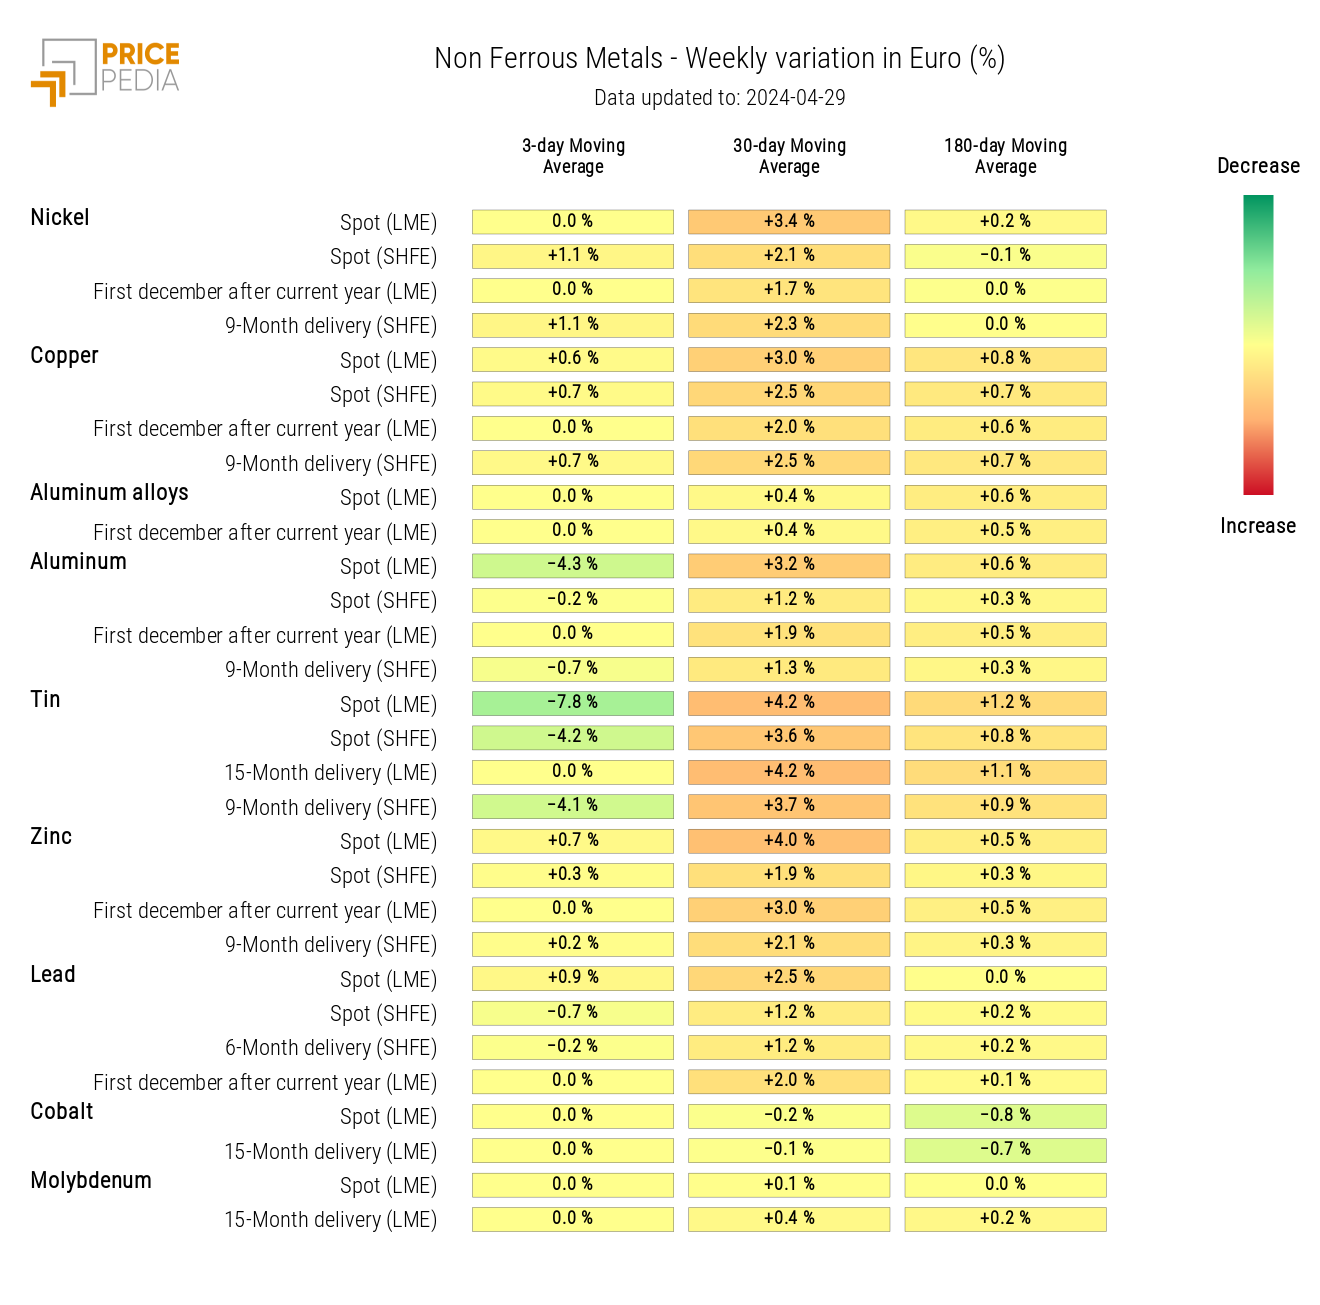
From the non-ferrous heatmap, a decline in tin and aluminum prices is evident.
Non-ferrous industrial metals prices heatmap in euros
FOOD
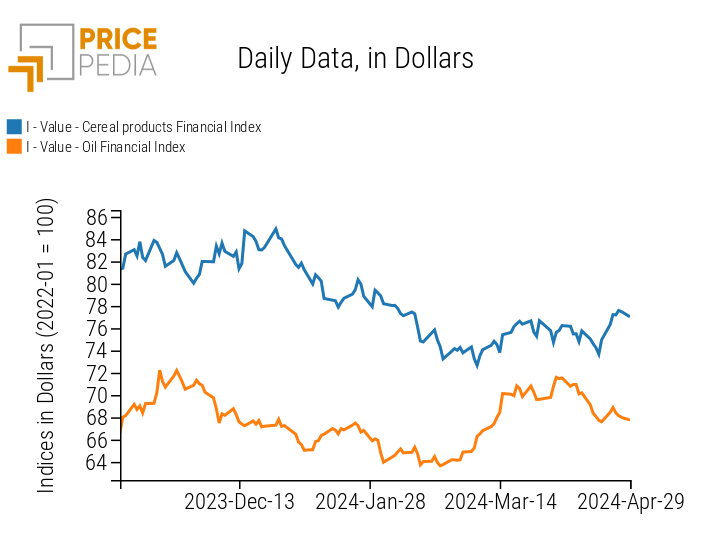
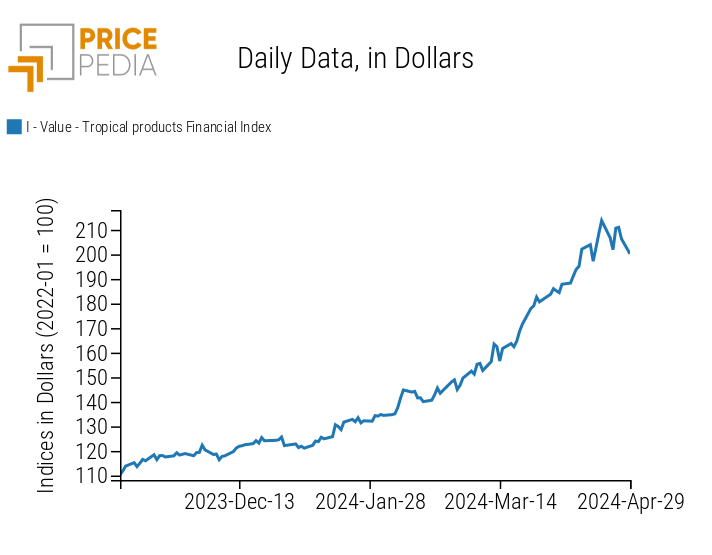
Financial indices of tropical foods and oils have recorded some oscillations during the week, while the cereal index has followed a strong rise at the beginning of the week, mainly driven by the increase in wheat prices.
| PricePedia Financial Indices of food prices in dollars | |
| Cereals and Oils | Tropical |
|
|
CEREALS
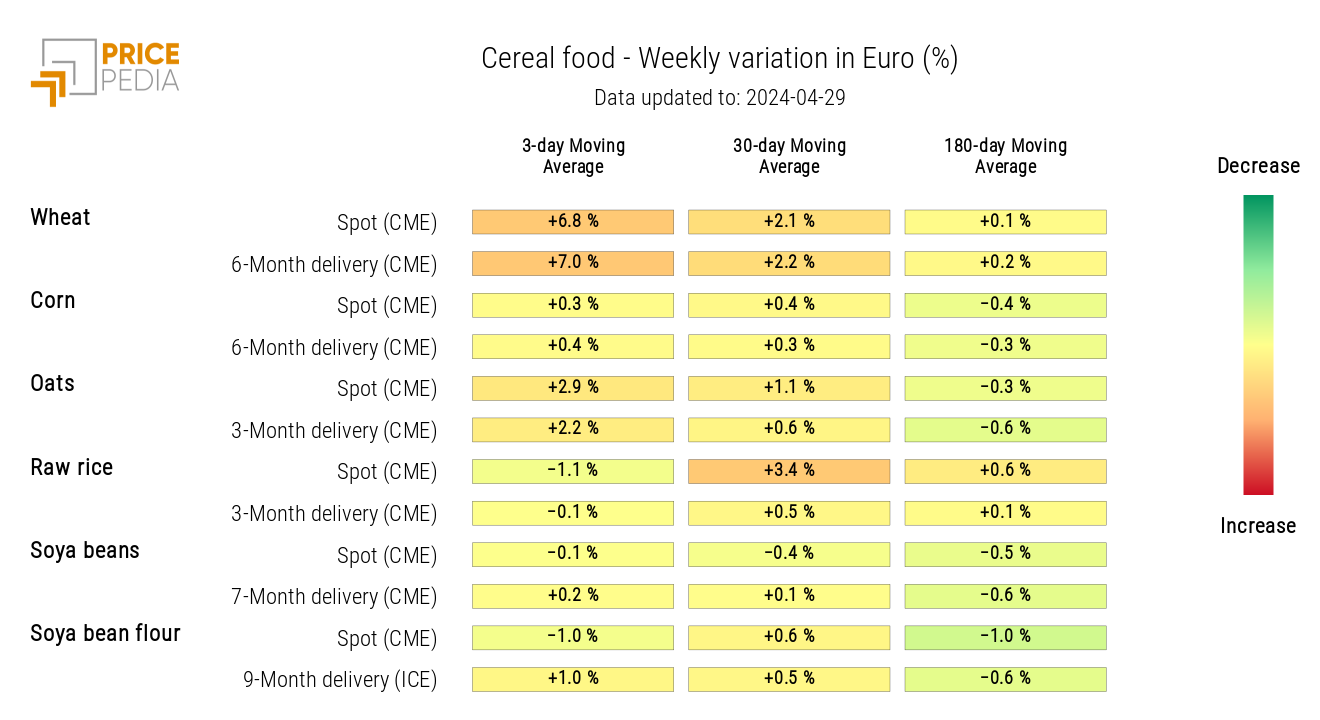
From the cereal heatmap, a significant increase in wheat prices is observed due to the current drought in Kansas, which has damaged the crop.
Cereal prices heatmap in euros
TROPICAL
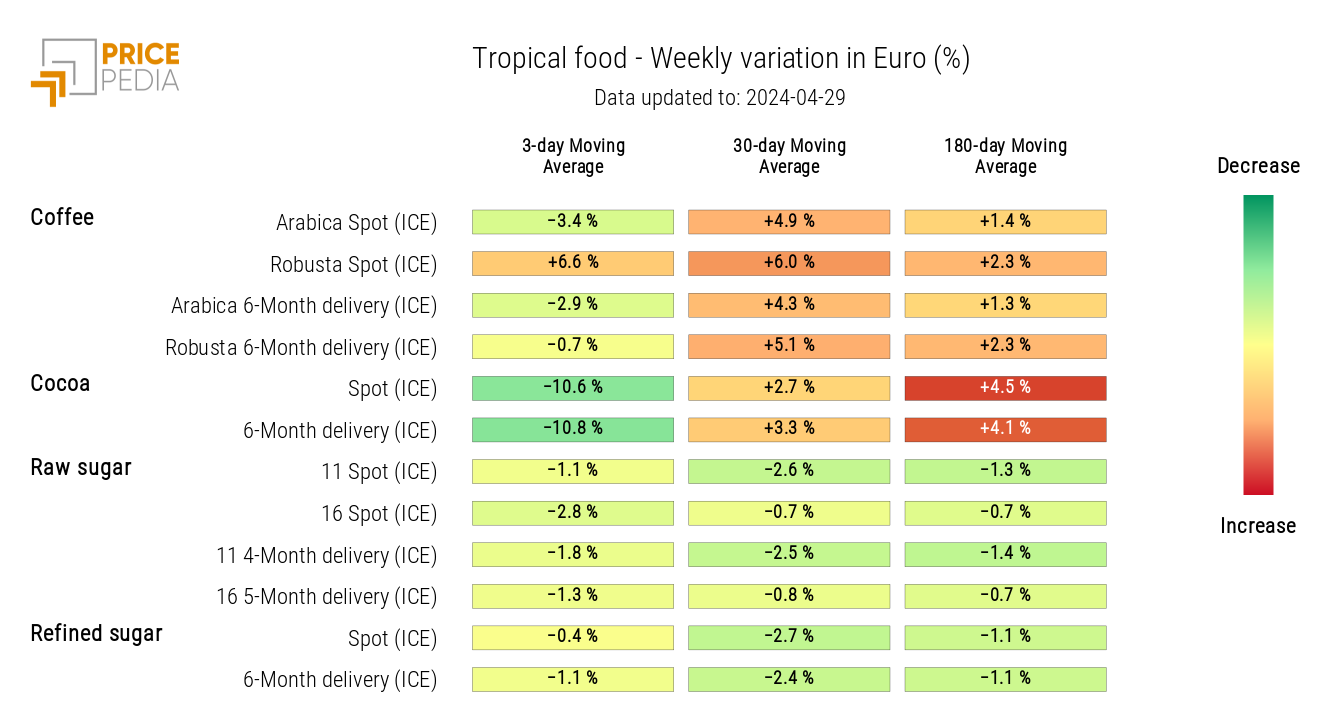
From the tropical food heatmap, a decline in cocoa prices is evident, while there is an opposite dynamic in the financial prices of the two coffees.
Despite Arabica coffee and robusta coffee being substitutes, this week saw a reduction in Arabica coffee prices alongside an increase in robusta coffee prices.
Tropical food prices heatmap in euros
