Sideways dynamics in commodity prices continue
PricePedia's Monthly Update for March 2024
Published by Pasquale Marzano. .
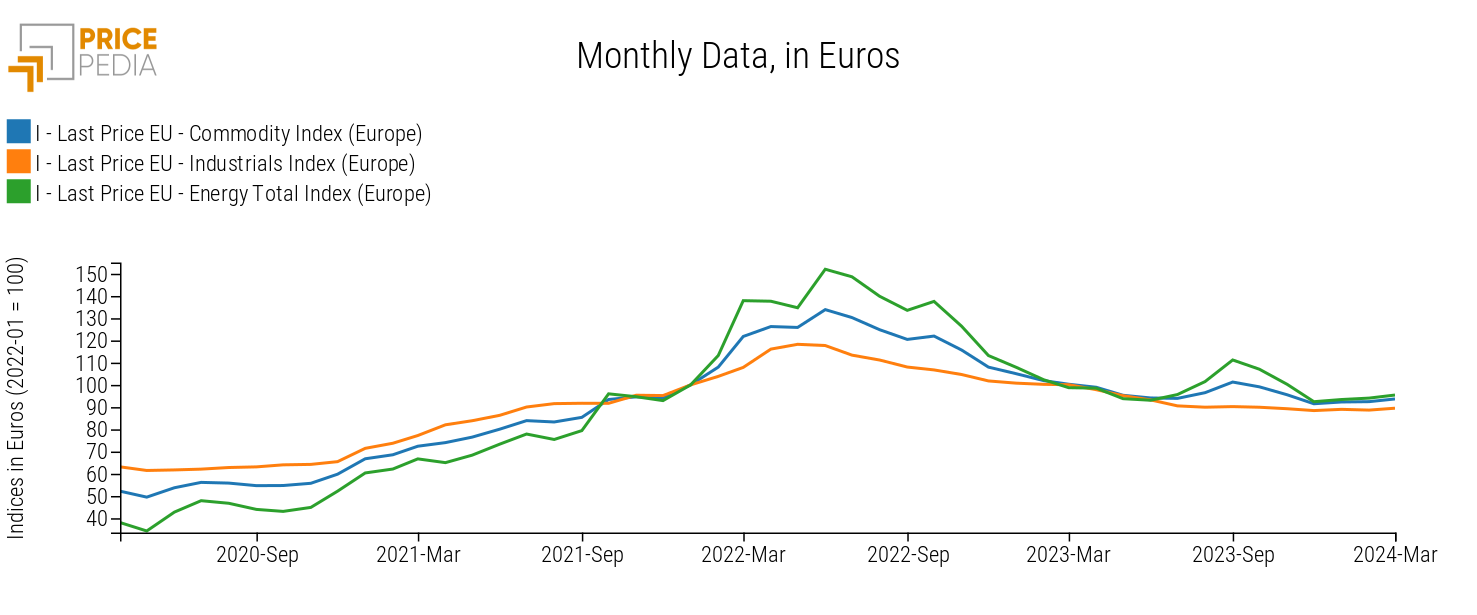
Last Price Global Economic TrendsThe monthly commodity price update for March 2024 has been released, confirming the sideways dynamics that have been ongoing for several months. The following graph shows the time series of PricePedia aggregate indices for Total Commodity[1], Industrials[2], and Total Energy, with their respective levels in January 2022 set as the base 100.

Since July 2023, the Industrial index has been fluctuating around the value of 89.5, which is the same as recorded in March, indicating that the current levels represent an equilibrium point. As for the Energy commodities index, over the same period, there have been short cycles with a phase of increase in the summer of 2023 and a subsequent decrease of equal magnitude in the following months. In March, there was a weak growth, with an increase of +1.5% compared to February values.
Commodity Prices by Product Category
Although overall aggregates show substantial stability in prices, some product categories exhibit more pronounced dynamics than others.Below is the graph illustrating the Month-on-Month changes in March 2024 compared to February 2024, in euros, referring to the PricePedia aggregate indices of product categories considered in the Total Commodity index (Industrials, Energy, and Food) and the Precious Metals category.
Graph 2: March 2024, variations (%) in euro with respect to February 2024
Source: PricePedia
Precious Metals are the product category that experienced the strongest increase in prices (+7%), supported by gold prices, which are considered a safe haven asset, and due to central bank purchases. Following that, the Plastics and Elastomers product family saw an average increase of +3.8%, also supported by increases in prices of products at the base of the corresponding supply chain, petroleum and natural gas, and that of Food (+2.4%). In particular, within the latter, products experiencing price tensions include olive oil, and, especially, cocoa beans, which reached a new historical high in March, surpassing that of just a month earlier.
As for the other product categories, there are modest month-on-month changes, below +2%.
Do you want to stay up-to-date on commodity market trends?
Sign up for PricePedia newsletter: it's free!
The following graph illustrates the Year-on-Year changes (March 2024 compared to March 2023) of the PricePedia aggregate price indices, in euros, of product categories.
Graph 3: March 2024, variations (%) in euro with respect to March 2023
Source: PricePedia
With the exception of precious metals, which remained stable compared to March 2023 values, from a year-on-year perspective, widespread price decreases are evident, indicating the weakness in global demand for industrial goods over the past eighteen months. However, this weakness has served to alleviate the pressure on commodity prices but has not been sufficient to return prices to pre-COVID-19 levels: compared to the 2019 average, commodity prices are +34% higher.
1. The PricePedia Total Commodity index is the aggregation of Industrials, Food and Energy indices.
2. The PricePedia Industrials index is the aggregation of indices related to the following categories: Ferrous Metals, Non-Ferrous Metals, Wood and Paper, Chemicals: Specialty, Organic Chemicals, Inorganic Chemicals, Plastics and Elastomers, and Textile Fibers.
Pasquale Marzano
Economist and data scientist. At PricePedia he deals with the analysis of commodity markets, forecasting models for raw material prices and management of reference databases.


