Trend following moves into the positive area
The number of positive trends outweighs the number of negative trends
Published by Luca Sazzini. .
Conjunctural Indicators Commodities Financial WeekCommodity Markets Trends
To get an overview of the trends in the commodity market, one can observe the movement of the global commodity trend index, developed by PricePedia. This index is constructed so that it takes positive values when bullish trends outnumber bearish ones and takes negative values otherwise. The higher the index value, the more numerous the upward trends in commodity financial markets.
Global Commodity Trend Index
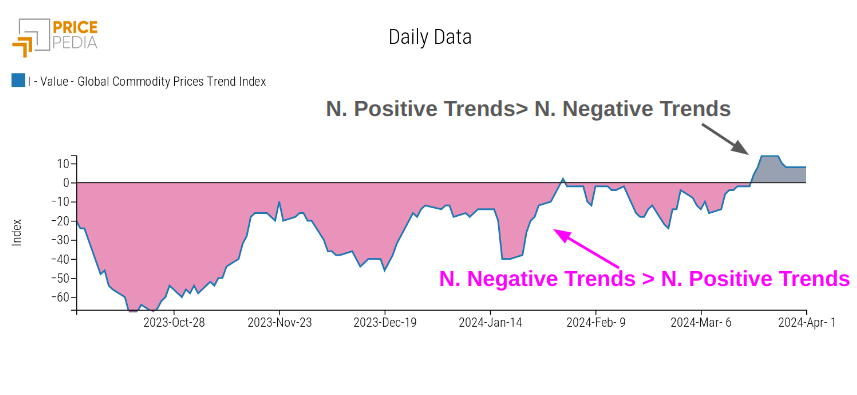
Analysis of the graph shows that since the beginning of last week, the index value has returned to positive values. This means that traders using trend-following strategies will begin to have a positive impact on commodity prices. However, it should be noted that currently, the speculative impacts of trend-following strategies remain very limited, as the index value is still very close to zero.
Among the positive trends characterizing the commodity market, those of gold and cocoa stand out. Both these prices, for very different reasons, have continued to set new historical highs even this week.
Gold prices continue to rise due to increased demand for gold from central banks, primarily the Chinese one, and due to the approach of the next interest rate cut.
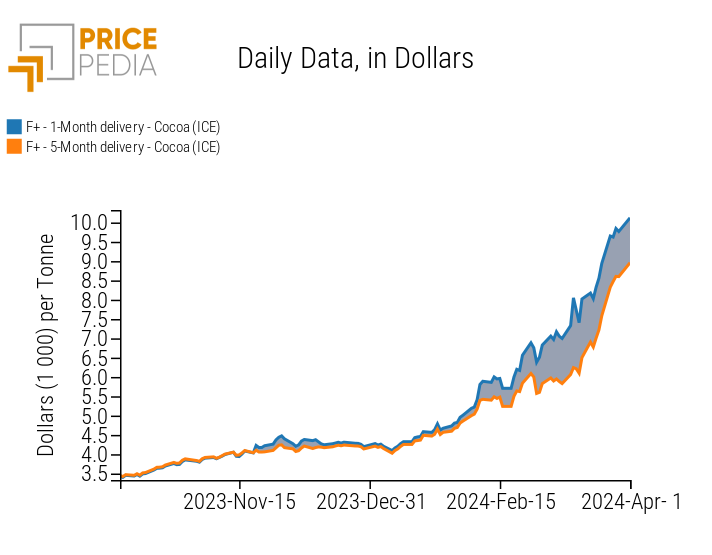
Cocoa prices, on the other hand, are driven both by the low market supply, due to the poor harvest in Ghana and Ivory Coast, and by trading strategies that have significantly contributed to price growth. In the recent period, numerous traders had made short sales betting on a decline in cocoa prices due to a possible harvest higher than that achieved. Today, these traders have been forced to buy cocoa to close their short positions, thus generating an increase in cocoa demand which has brought the cocoa price close to the €10,000 per ton threshold.
Below are the price trends of gold quoted on the Chicago Mercantile Exchange (CME) and cocoa prices quoted on the Intercontinental Exchange (ICE). The charts also show the prices of futures (12 months for gold and 5 months for cocoa), highlighting the different situation characterizing the two markets. The gold market is in a contango situation, with the 12-month price leading the spot price. The cocoa market is instead in a backwardation situation, with the spot price reflecting the current market imbalance, greater than expected for the coming months.
| Price of gold quoted on the Chicago Mercantile Exchange (CME) | Price of cocoa quoted on the Intercontinental Exchange (ICE) |

|
|
US Inflation
On Friday, March 29, the new data on the Personal Consumption Expenditures Index (PCE), the Federal Reserve's preferred index for monitoring the inflation rate, was released.
The PCE index reported a monthly inflation growth rate of 0.3% and an annual growth rate of 2.5%, compared to estimates of 0.4% m/m and 2.5% y/y. The core data, i.e., data excluding the most volatile goods (energy and food), reported a monthly growth of 0.3% and an annual growth of 2.8%.
Although these data frame a still high US inflation rate, they have proven to be consistent with analysts' expectations, and therefore the market continues to anticipate an interest rate cut in June 2024.
ENERGY
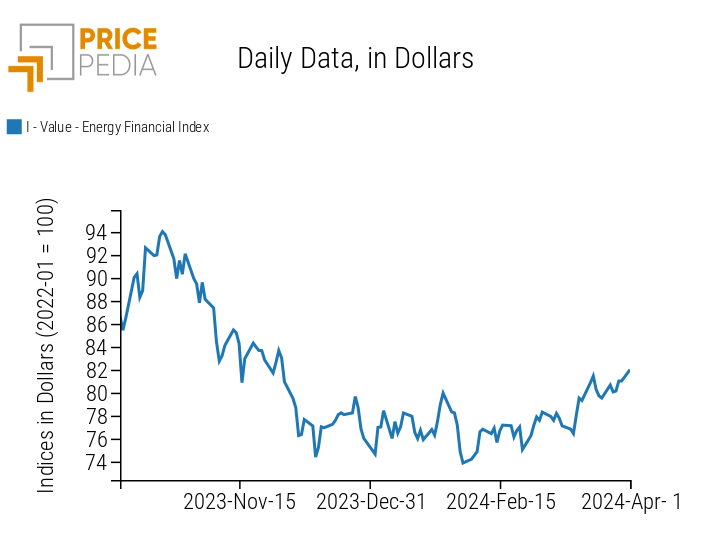
This week, the financial index of energy products maintained the same price levels, recording only weak oscillations.
PricePedia Financial Index of Energy Prices in Dollars
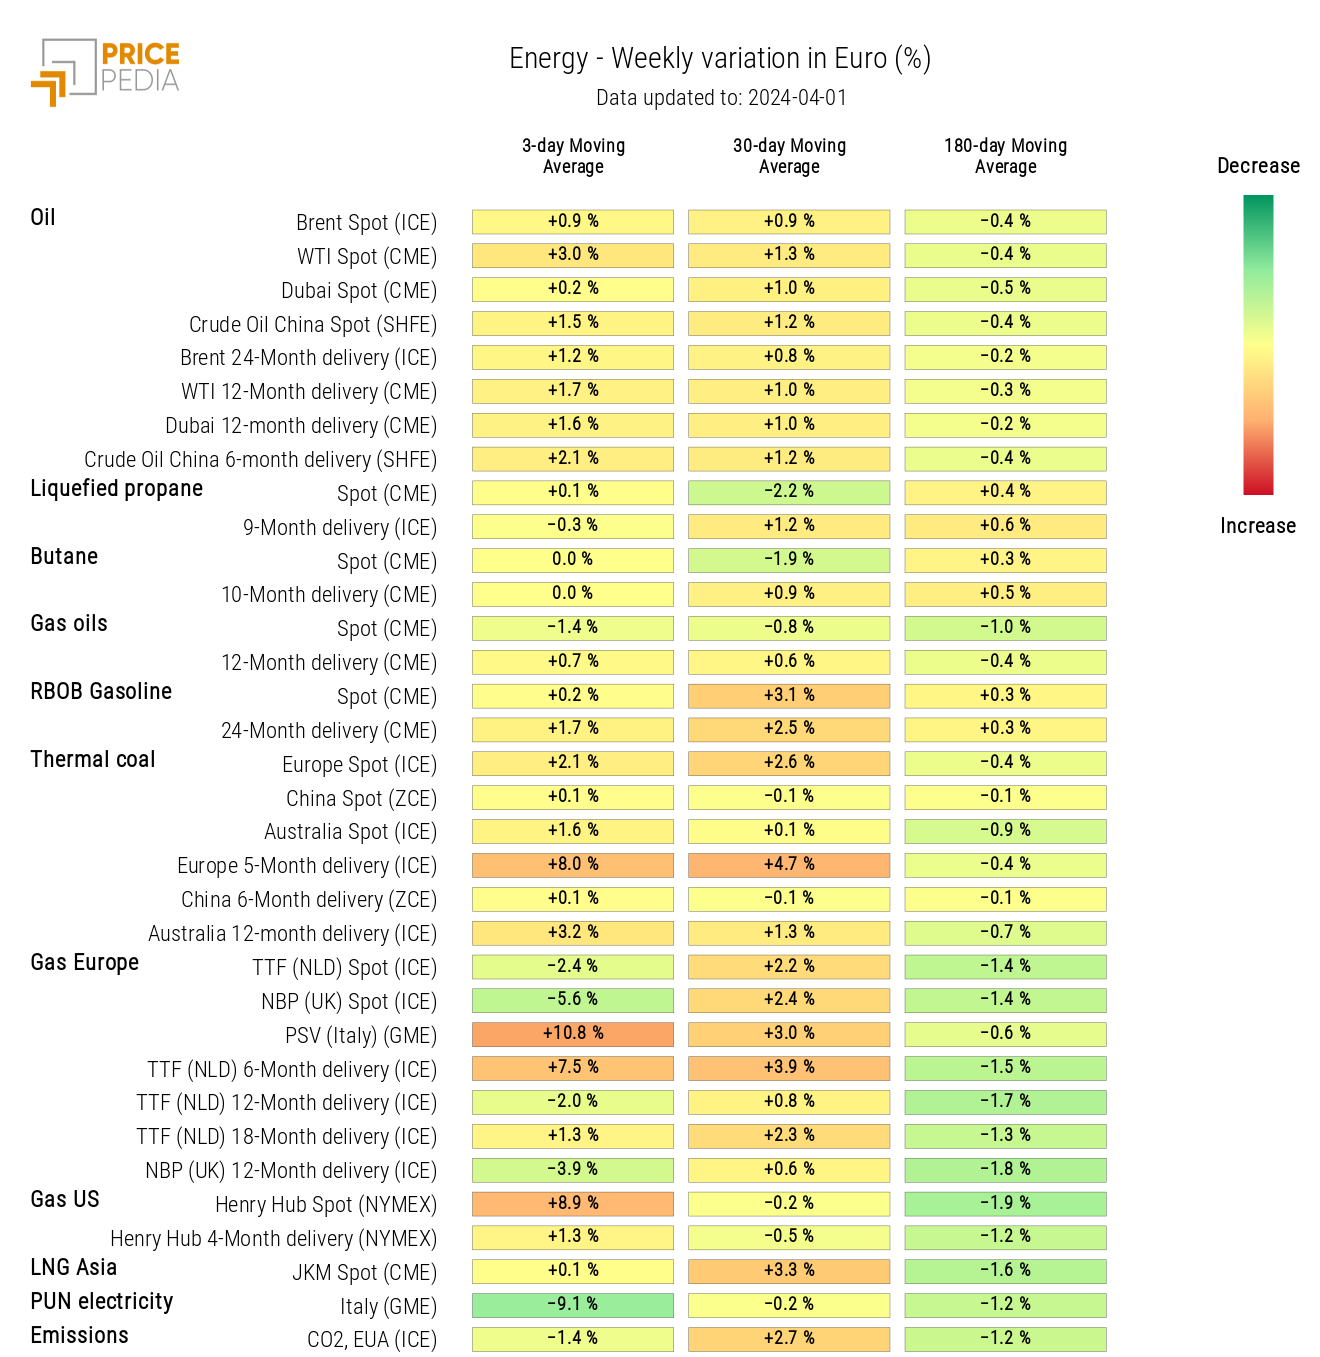
The heatmap of energy products signals less intense price variations than usual. There is, in particular, an increase in PSV and US gas for spot prices.
HeatMap of Energy Prices in Euros
PLASTICS
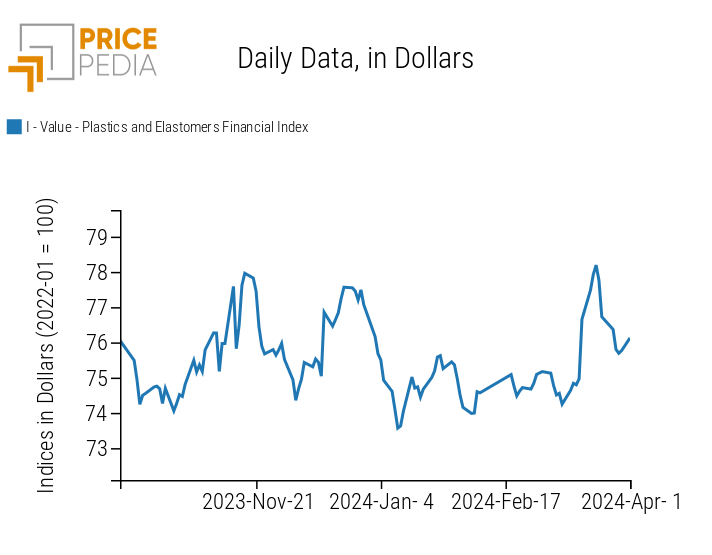
The financial index of plastics quoted in China registers a strong negative variation, particularly accentuated by the prices of RSS3 rubber.
PricePedia Financial Index of Plastics Prices in Dollars
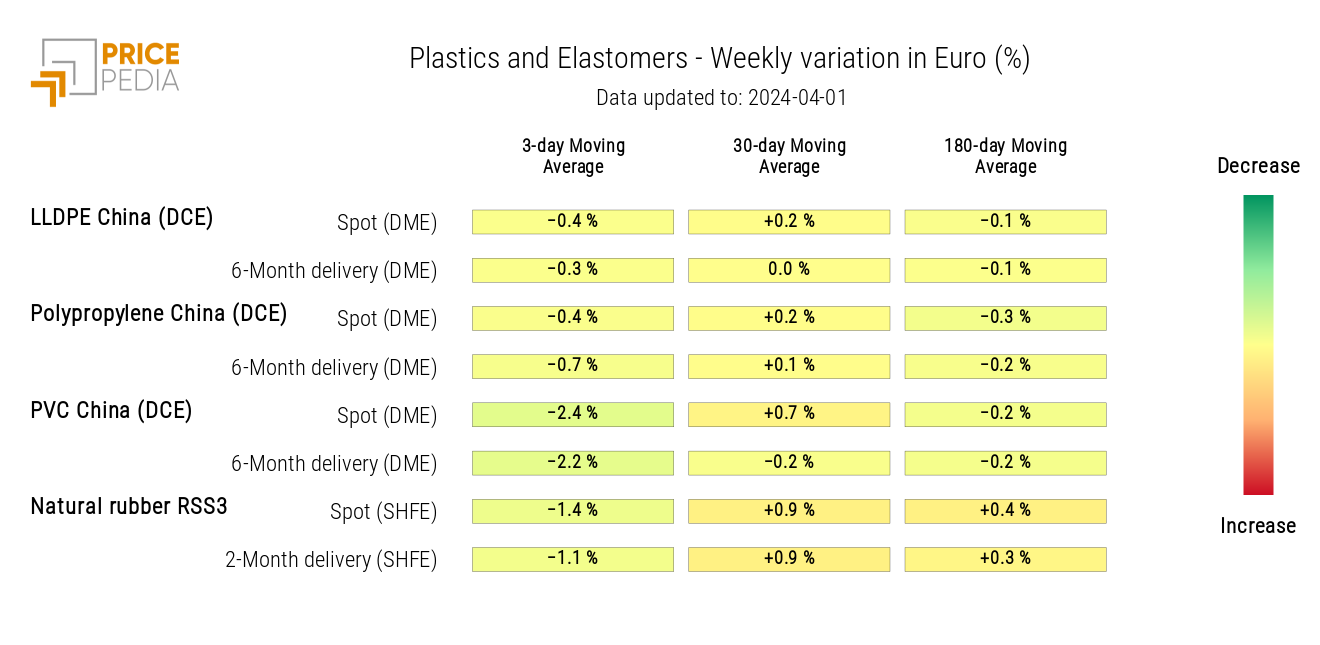
The plastics heatmap also highlights, in addition to the decline in RSS3 rubber, reductions for all other products included in the index.
HeatMap of Plastics Prices in Euros
FERROUS METALS
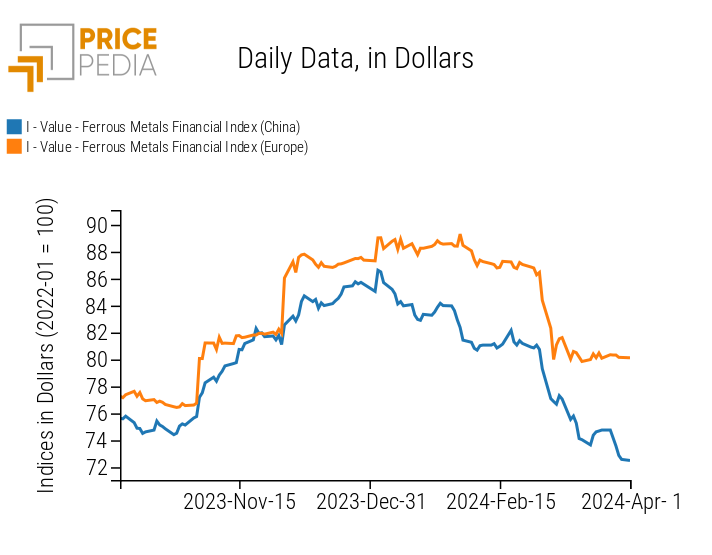
This week, the financial index of Chinese ferrous metals resumes its decreasing trend dynamic, after the brief pause last week. The European ferrous index, on the other hand, remains stable, mostly recording sideways variations.
PricePedia Financial Indices of Ferrous Metals Prices in Dollars
Do you want to stay up-to-date on commodity market trends?
Sign up for PricePedia newsletter: it's free!
INDUSTRIAL NON-FERROUS
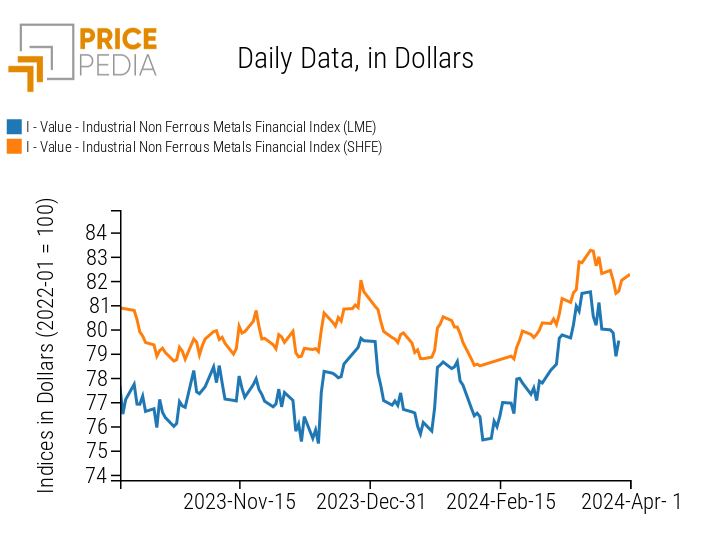
Prices of non-ferrous metals, quoted on the London Metal Exchange (LME) and the Shanghai Futures Exchange (SHFE), continued the decline in prices from last week, with a slight recovery in the last two days of the week.
PricePedia Financial Indices of Industrial Non-Ferrous Metals Prices in Dollars
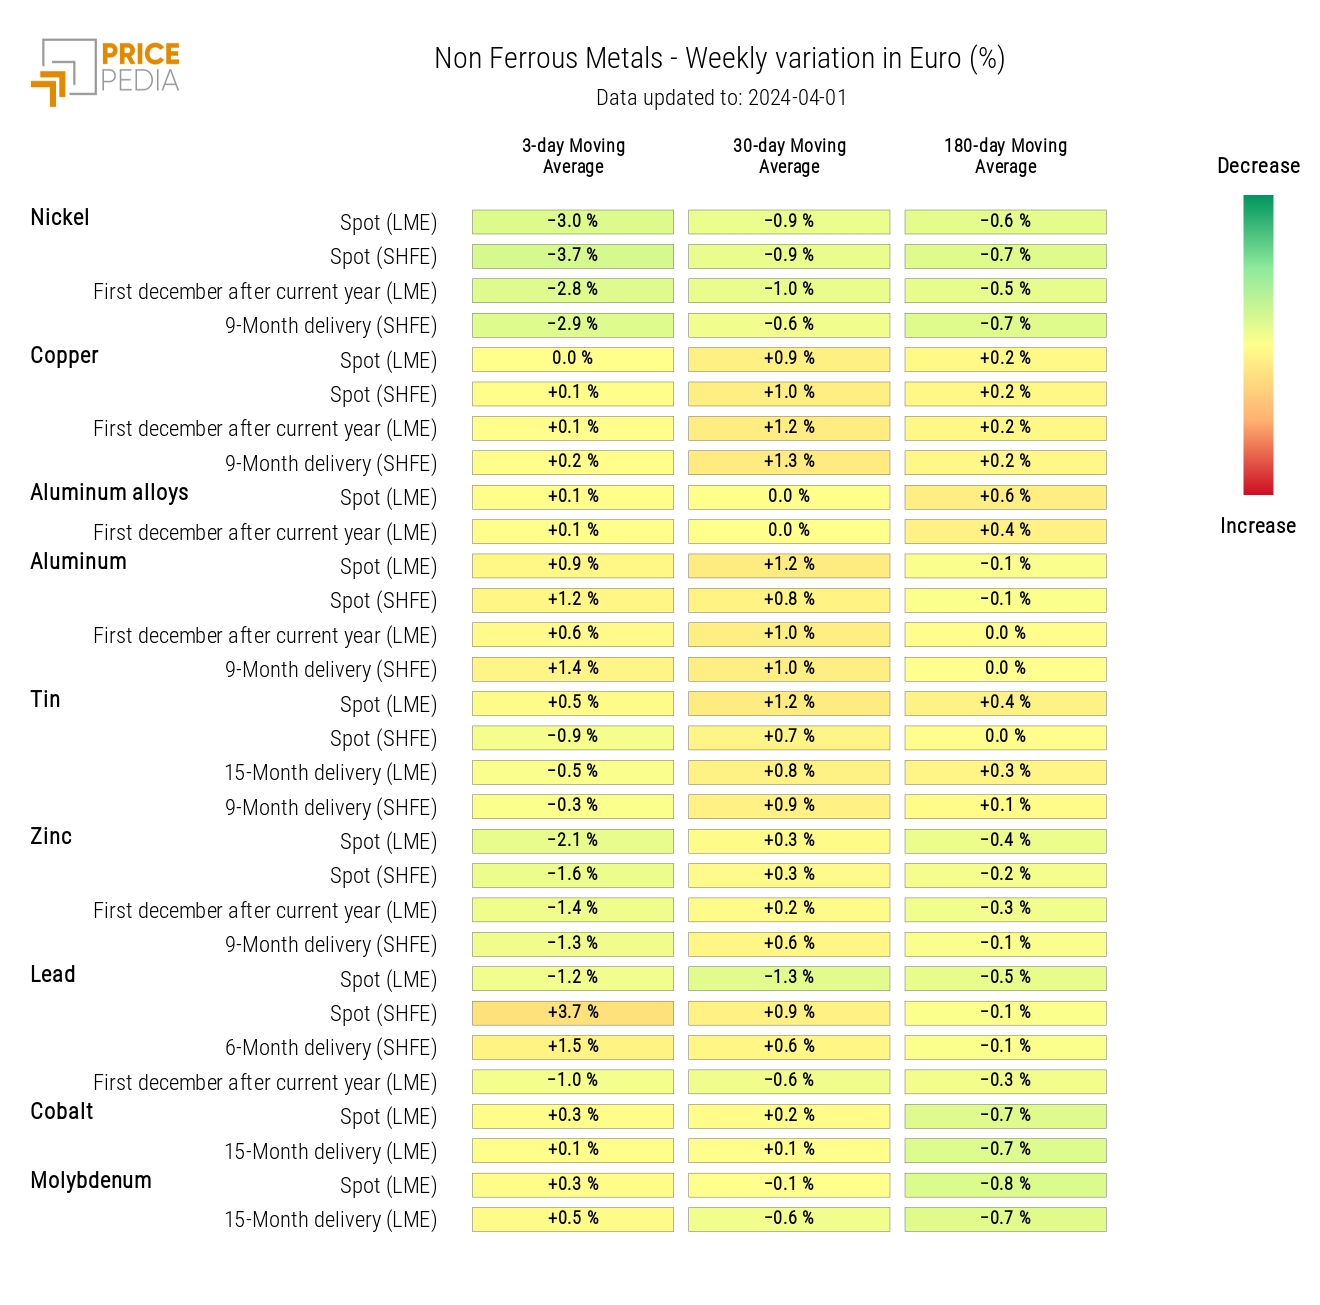
The heatmap of industrial non-ferrous metals highlights the most pronounced declines in nickel and zinc prices.
HeatMap of Industrial Non-Ferrous Metals Prices in Euros
FOOD
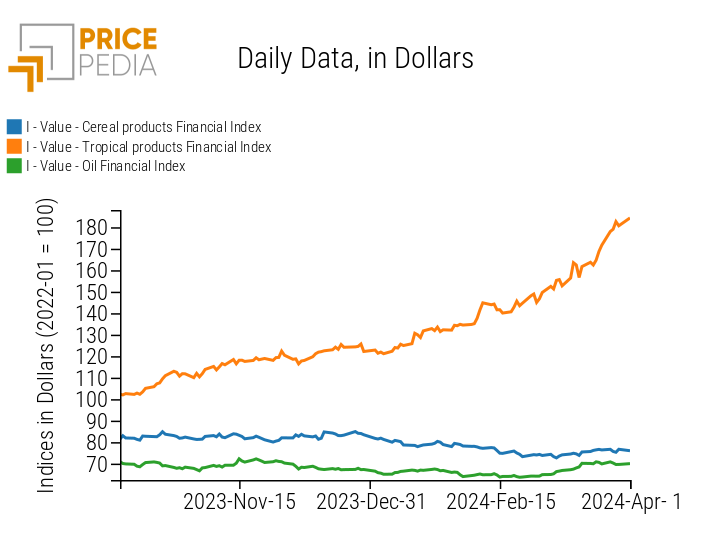
The financial index of tropical foods continues its rise driven by cocoa prices, while the cereal and edible oil indices record slight price oscillations.
PricePedia Financial Indices of Food Prices in Dollars
TROPICAL
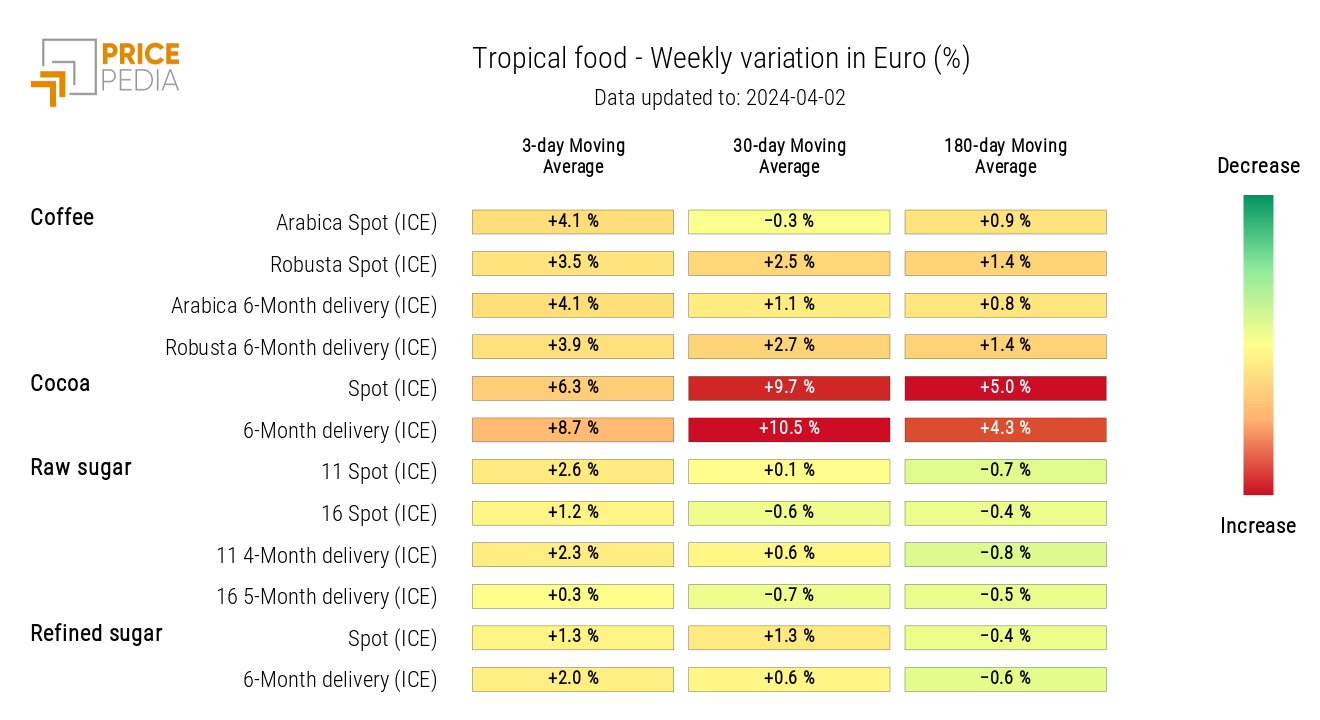
The heatmap of tropical foods highlights an intense weekly variation in the three-day moving average of financial cocoa prices quoted on the ICE. This high growth is attributable both to weather conditions, which have damaged the cocoa harvest, and to trading strategies that have accentuated the dynamics.
Signs of increases also come from the prices of other products included in the index.
HeatMap of Tropical Food Prices in Euros
