Evidence of increases in financial commodity prices
Actual or expected drops in supply are reflected in a general increase in weekly prices
Published by Luca Sazzini. .
Conjunctural Indicators Commodities Financial WeekThe growth of the World Container Index, the main reference index for maritime transport costs, updated by Drewry consultancy firm, kept going over the last days.
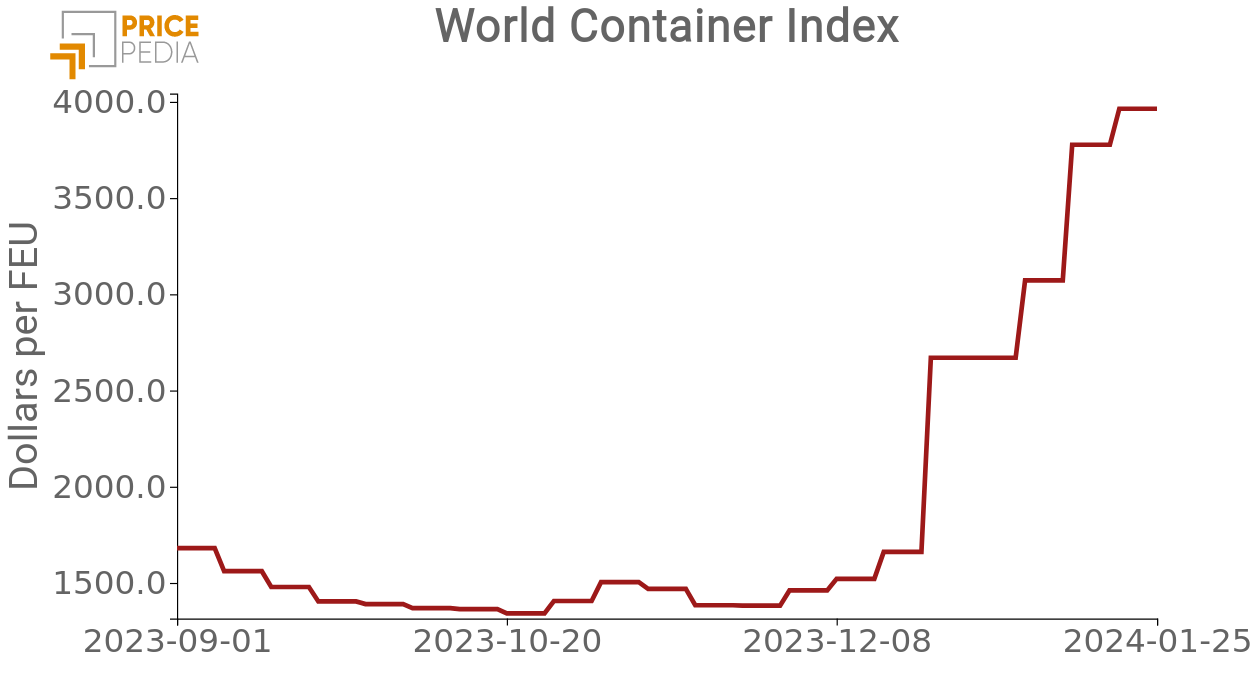
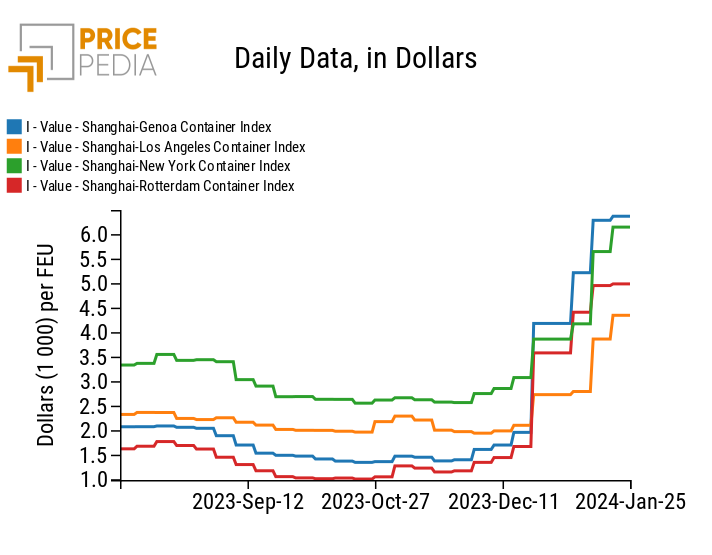
This week, unlike the previous ones, the growth of the index depended above all on the increase in costs of the Shanghai-Los Angeles and Shanghai-New York routes, which compared to last week underwent variations of 12.54% and 8.84% respectively. These data are attributable to the worsening of global logistics, characterized by longer delivery times caused by the lengthening of naval routes between Asia and Europe. The trade routes of Shanghai-Rotterdam (+0.67%) and Shanghai-Genoa (+1.3%) have instead stabilized, given the already very high level reached in the previous weeks due to the Houthi attacks on ships transiting the Red Sea.
Freight prices for routes departing from Shanghai
Commodity market analysis
On the commodity front, various short-term dynamics occurred which mainly impacted the non-ferrous industrial metals market and the energy price market.
Non-ferrous metals were characterized by significant growth in the first days of the week, driven above all by the trend in aluminium prices. The latter in fact suffered a leap in the first few days of the week due to the latest news regarding new EU sanctions against Russia. In the last year the EU imported 621 million kg of raw aluminum from Russia, but this flow could be eliminated if the ban on its imports is included in the next package on EU sanctions on Russia, as requested by Poland and the Baltic countries.
Another non-ferrous metal that has recorded significant weekly growth is copper. New data reported by the International Copper Study Group (ICSG) shows that the copper market remained in a supply deficit of 119 thousand tonnes in November 2023. A total deficit of 130 thousand tonnes is also estimated in the first 11 months of the year, in the face of weak mining production and higher demand (particularly in China).
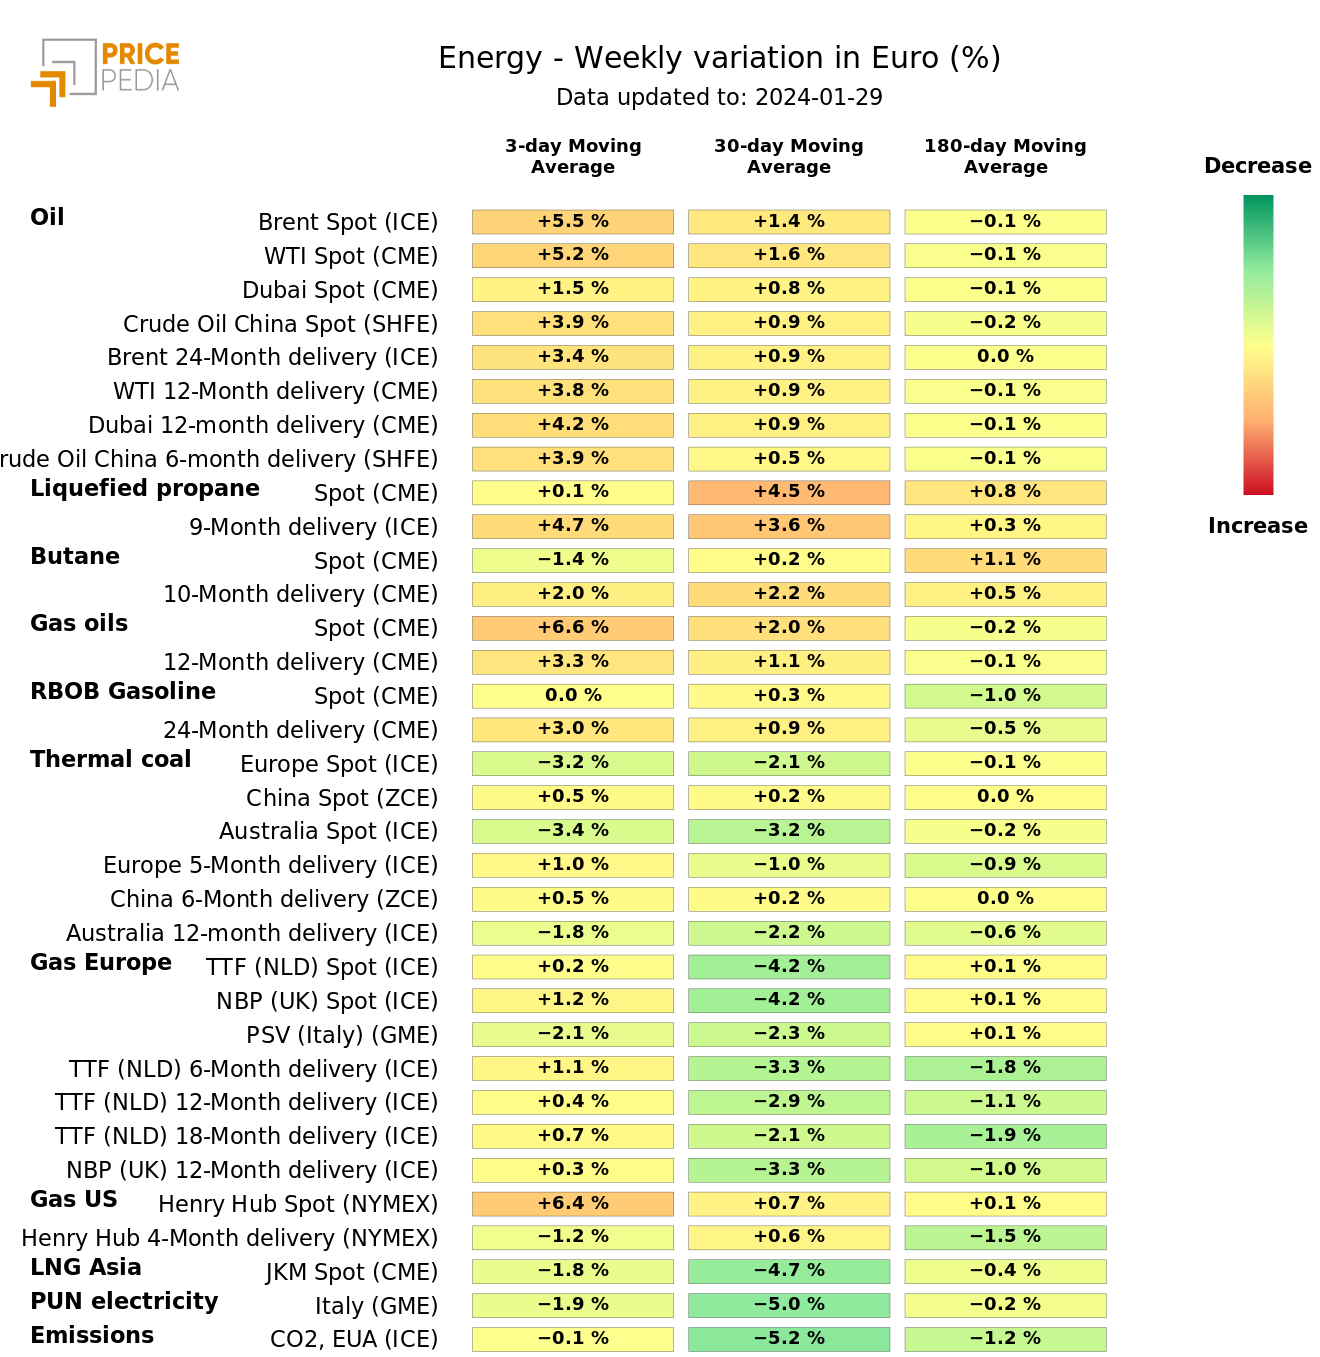
The energy sector also experienced a significant weekly increase, due to the temporary decline in US oil supply. The freezing US weather has resulted in a temporary halt in oil production in North Dakota, leading to a decline in US oil supplies. Over the past week, the American Petroleum Institute (API) estimates a reduction in US oil inventories of 6.67 million barrels, while the Energy Information Administration (EIA) estimates a decline in inventories of 9.2 million barrels. The growth in oil prices, however, is expected to be a short-term phenomenon, given that the Brent financial market is currently in a state of backwardation, with future prices increasingly lower as it moves away from the delivery date.
However, the downward trend in the price of natural gas TTF (Netherlands) continues, despite Qatar's declarations regarding delays in LNG deliveries to Europe.
The latest sector to record significant changes was the Chinese plastic materials market, which recorded an increase in prices in relation to the weekly growth in oil prices.
Short-term trend in global activity levels
At the meeting on Thursday, January 25, the ECB's governing council decided to keep interest rates unchanged at 4.5%. President Christine Lagarde warned the market that it is still premature to talk about a next interest rate cut, which according to analysts should arrive in June 2024.
New data about US GDP show an annualized quarterly growth rate of 3.3%, much higher than consensus analysts' expectations of 2%. Growth is still driven by family consumption (2.8%), with an additional contribution from net exports.
The GDP deflator slowed to 1.5% QoQ on a yearly basis in the first quarter, with a core consumption deflator at 2% QoQ for the second consecutive quarter.
We are waiting for the US FOMC meeting next week, from which analysts expect current US interest rates to be maintained.
ENERGY
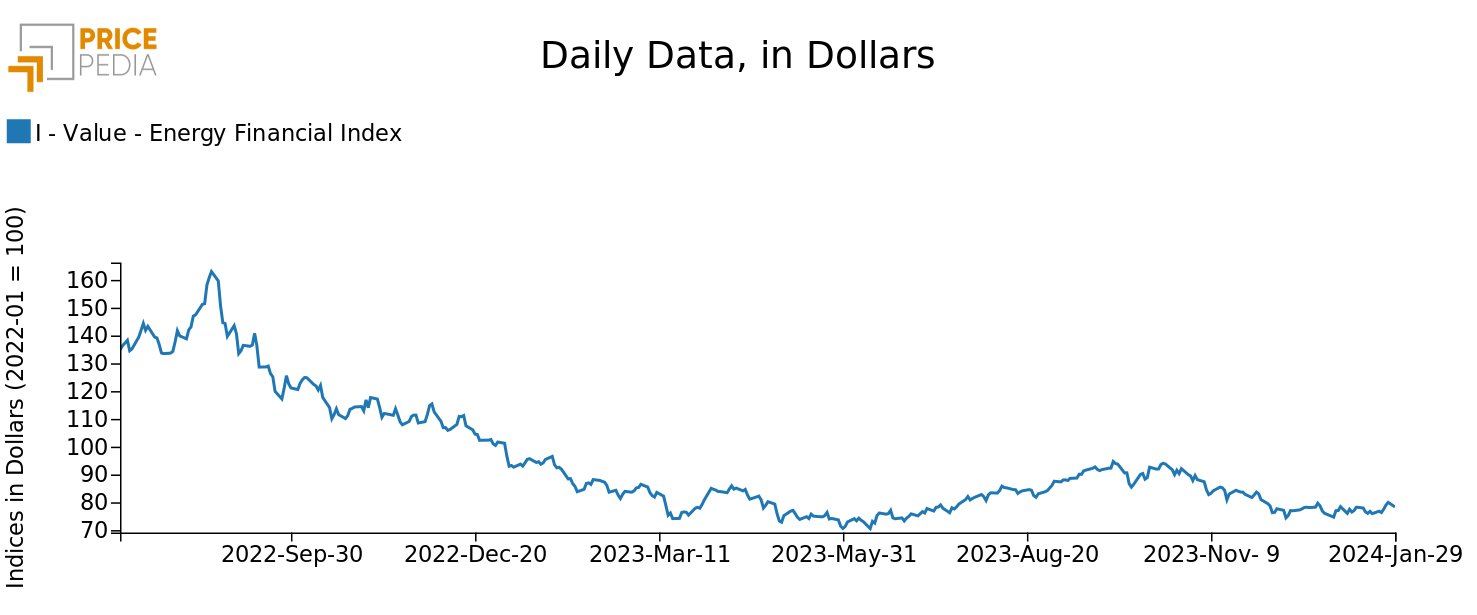
PricePedia's energy financial index has been on an upward trend this week, driven by a temporary decline in U.S. oil supplies.
PricePedia Financial Index of energy prices in dollars
The energy heatmap signals the weekly increase in the three-day moving average of oil prices.
HeatMap of energy prices in euros
PLASTIC MATERIALS
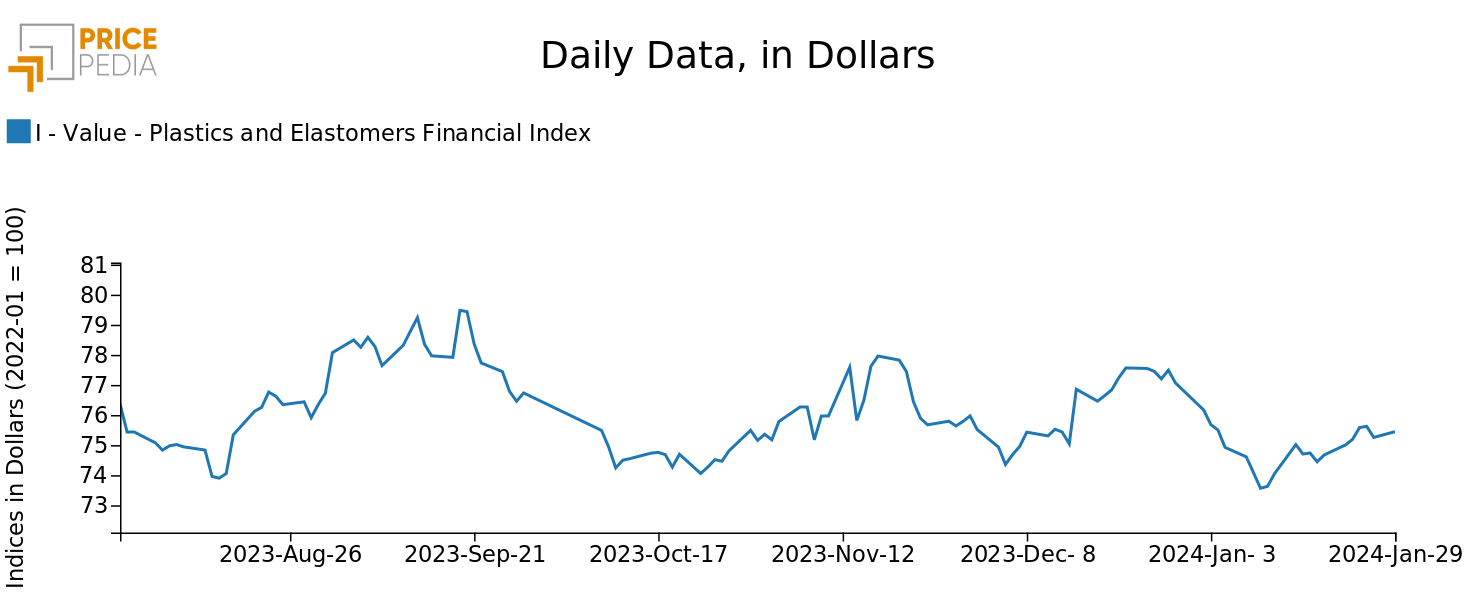
The financial index of plastics listed in China starts the week with a rise, led by the growth in oil prices, before easing towards the weekend.
PricePedia Financial Index of dollar prices of plastic materials
FERROUS METALS
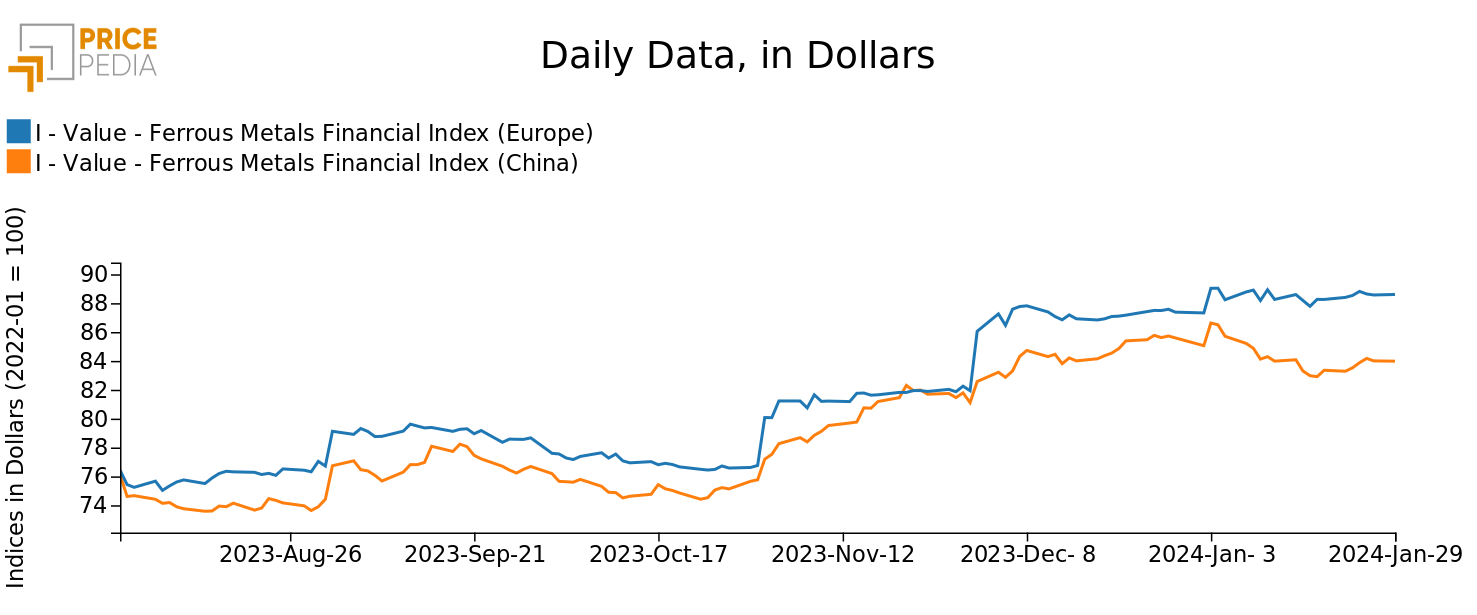
The two financial indexes of ferrous products recorded a slight growth, albeit at very modest rates.
PricePedia Financial Indices of dollar prices of ferrous metals
INDUSTRIAL NON-FERROUS
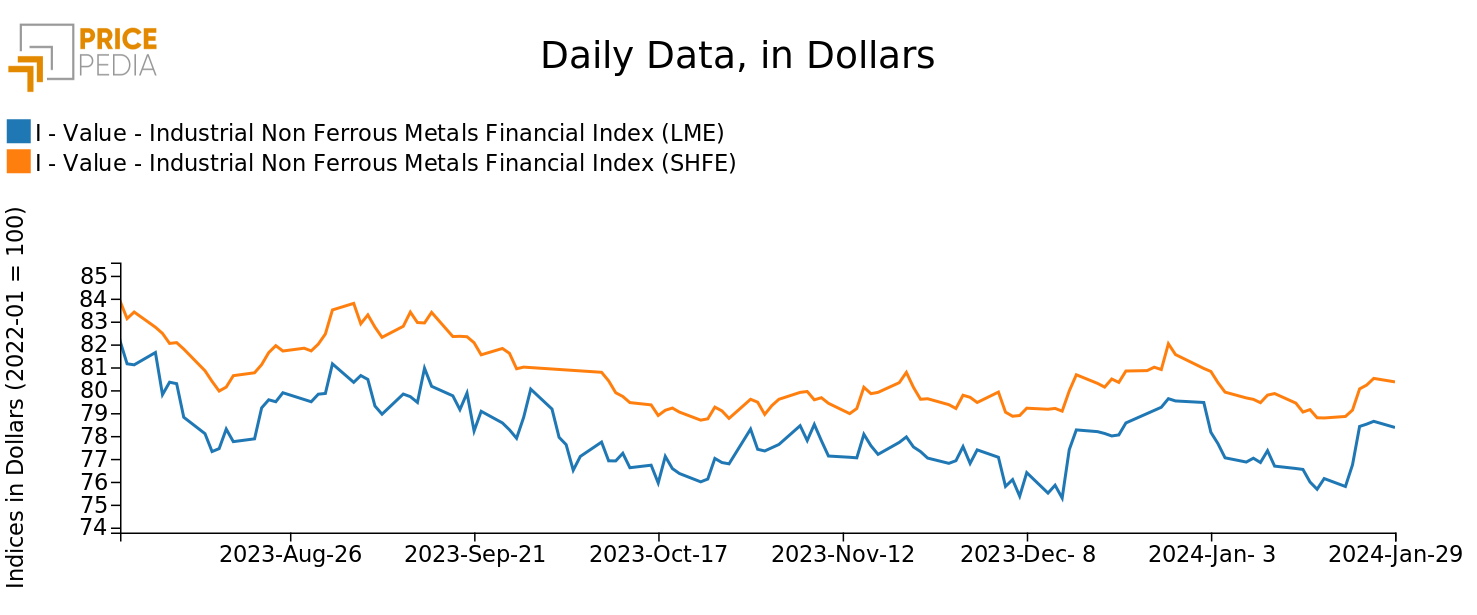
Both non-ferrous indexes recorded a significant increase in prices, with a more pronounced growth for the prices of the London Metal Exchange. The greater growth of the LME market, compared to that of the SHFE market, is largely due to the greater increase in European aluminum prices, due to possible further sanctions from the European Union against Russia.
PricePedia Financial Indices of dollar prices of industrial non-ferrous metals
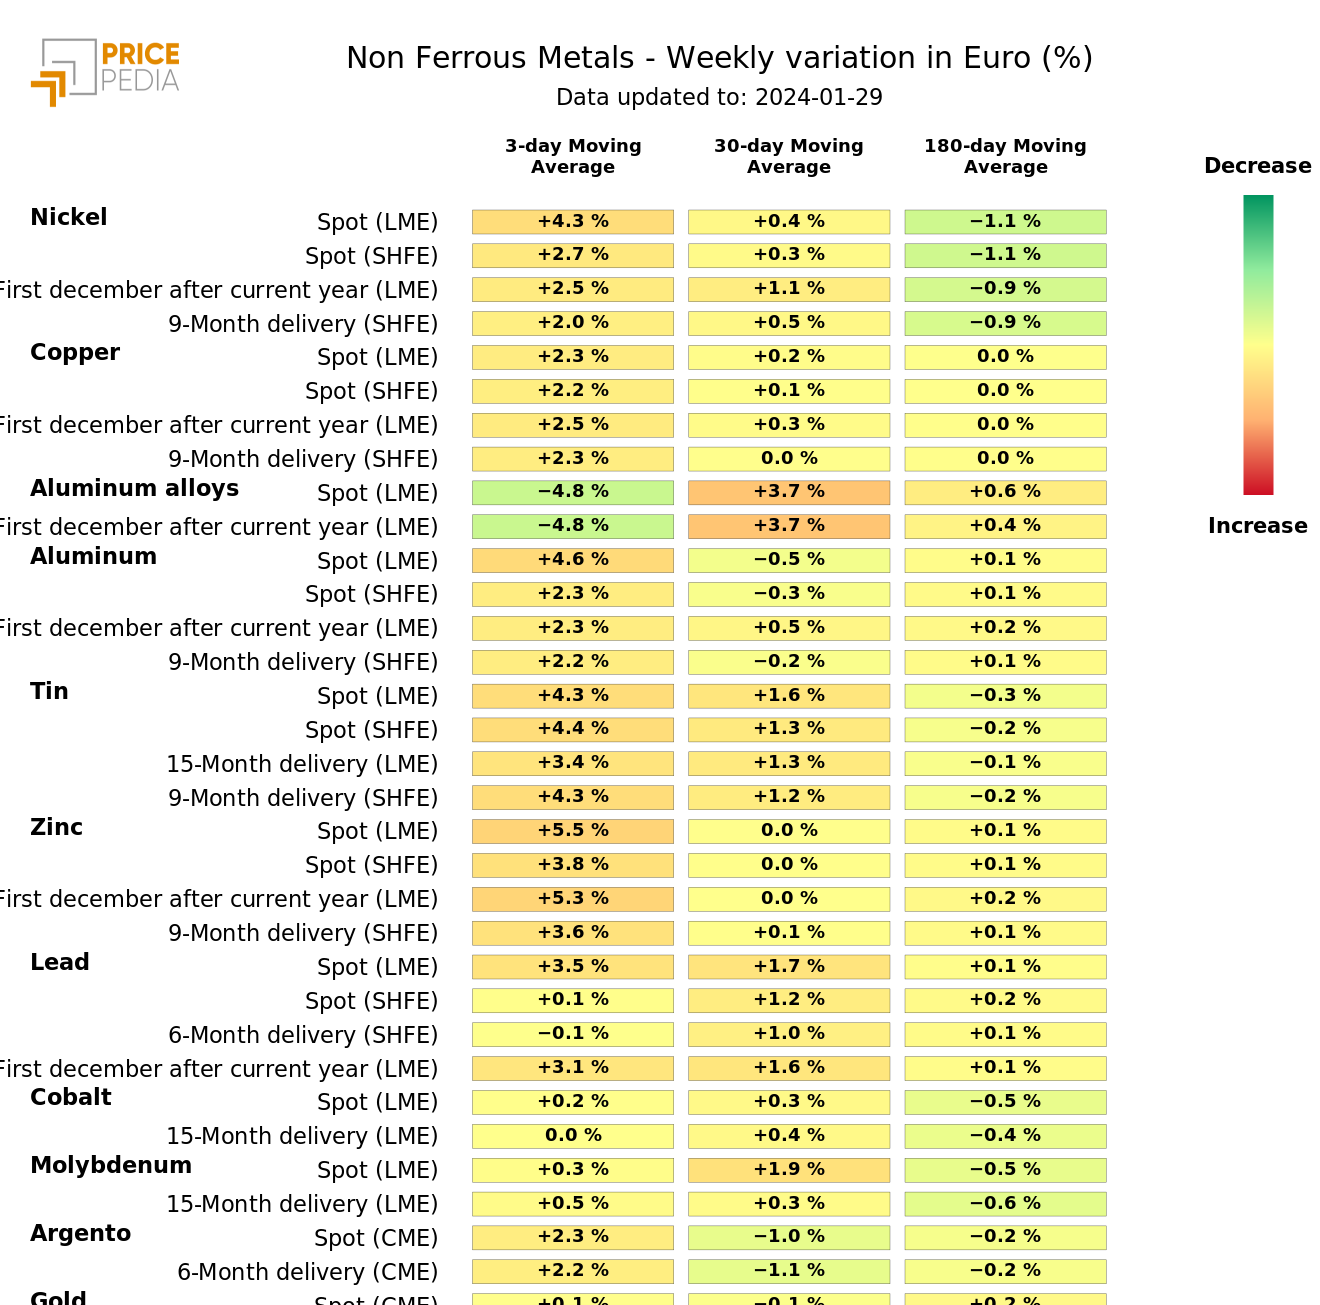
The heatmap shows an increase in the prices of nickel, copper, tin, zinc and lead, compared to a drop in the prices of aluminum alloys.
HeatMap of industrial nonferrous metal prices in euros
FOOD
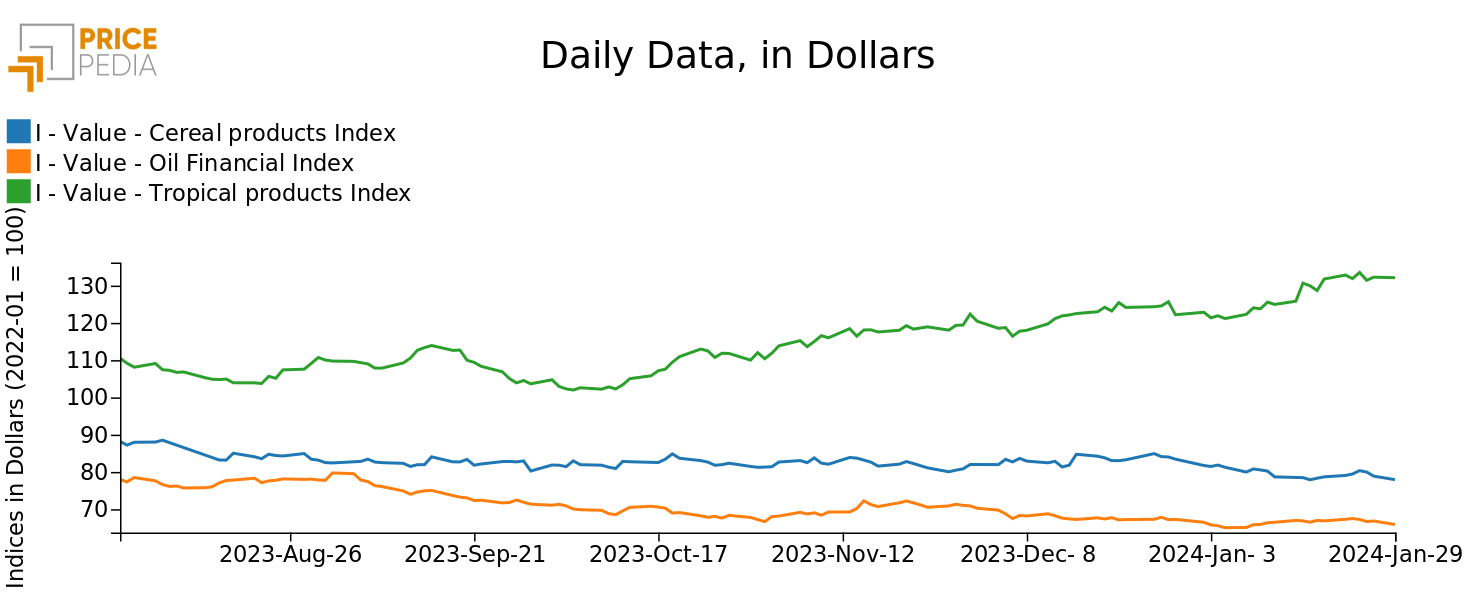
The three food indices remained relatively stable, with slight positive fluctuations at the beginning of the week and weak declines in the last few days.
PricePedia Financial Indices of food prices in dollars
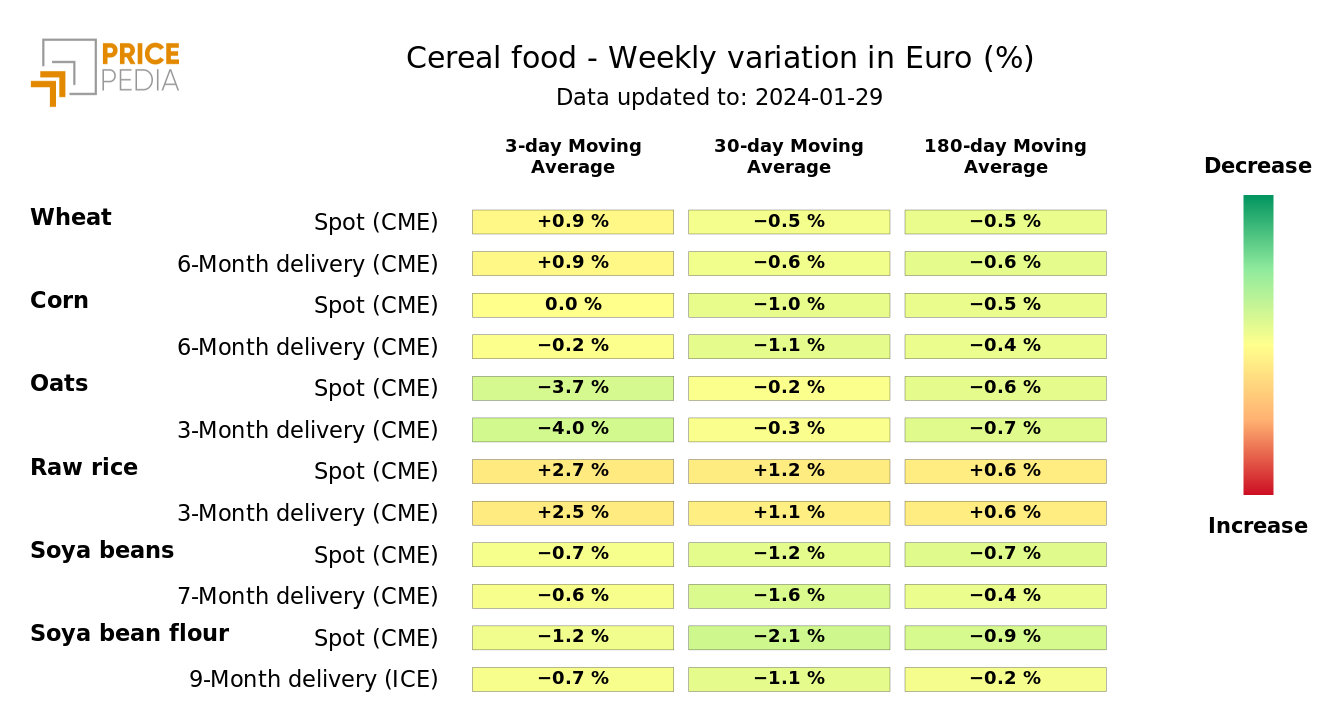
The cereal heatmap signals a more intense increase in raw rice prices.
HeatMap of cereal prices in euros
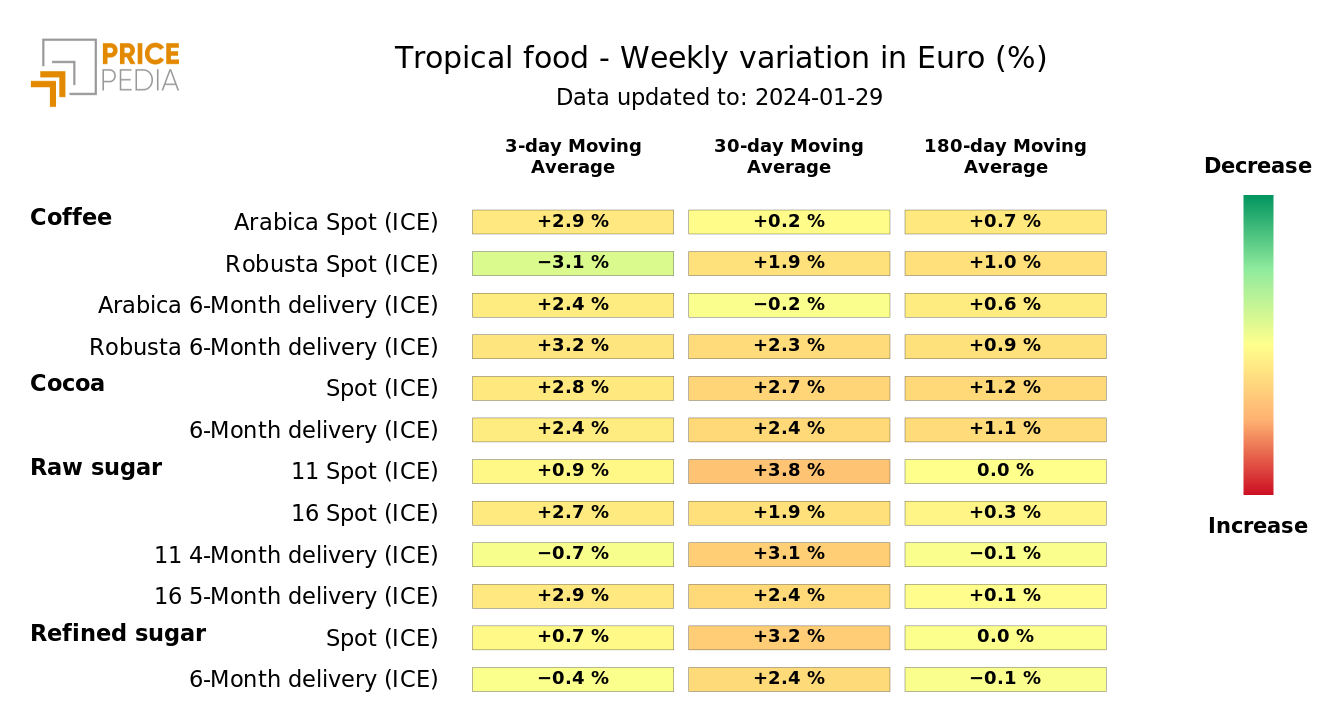
PricePedia's tropical food heatmap is colored orange, except for the spot price of Robusta coffee.
HeatMap of tropical food prices in euros
