The 2020-2023 price cycle: the case of thermoplastics
In the last three years, the prices of thermoplastics have recorded increases and decreases of an intensity never experienced before
Published by Luca Sazzini. .
Basic thermoplastics Commodity price cycle 2020-2023
One of the commodity families that has characterized the price cycle from the outbreak of the pandemic to today has been those of thermoplastics. In fact, in euros
the aggregate index of this family, after reaching a minimum point in May 2020,
recorded a phase of accelerated growth that led the index to reach an all-time high point in April 2022, with an increase of 112% over 23 months.
The exceptional nature of this growth is evident if we consider that the previous phase was more intense
of thermoplastic prices occurred between the beginning of 2009 and the beginning of 2011,
with a growth of "only" 70% in two years.
Equally exceptional was the fall phase that began in mid-2022
which led the average prices of thermoplastics to fall by 31% in the space of just over a year.
In this article we will analyze some facts that characterized this cycle.
The following graph shows the PricePedia index of thermoplastics on the EU physical market, compared with the Brent oil price index and the financial price index of plastics and elastomers recorded on the Chinese DCE stock exchange.
Thermoplastic price index and Brent price

The graph shows the "anomalous" cycle of thermoplastics in the four-year period 2020-2023, always driven by the price of oil, but with some differences compared to past cycles:
- at the maximum point the price of thermoplastics comes closest to the maximum point of the oil price;
- the phase of falling prices in 2022 was anticipated by the price of thermoplastics, especially the financial one.
Naturally, the aggregate indices of thermoplastics "hide" specificities at the product level that can be significant for understanding the forces that determined this cycle. It may therefore be useful to examine the price dynamics of thermoplastics during the last cycle, at the price level of individual products.
The financial prices of thermoplastics
The following table shows the average trend of financial prices of plastic materials with the addition of the price of Brent oil, the main determinant of the costs of plastic materials.
The table shows the average prices of some periods which are relevant to highlight the price dynamics in the cycle considered: average of the years 2020, 2021 and 2023 and average of the two semesters of 2022. The last column also shows the precise price of December 2023 to allow the reader an updated evaluation of the prices considered to date.
| Financial prices for plastic materials | |||||||
| (dollars per ton) | |||||||
| 2020 | 2021 | H1-2022 | H2-2022 | 2023 | 2023-12 | ||
| Quotes on the Chicago Mercantile Exchange (CME): | |||||||
| - Ethylene | 726 | 494 | 430 | 415 | |||
| - Propylene | 1 311 | 812 | 915 | 980 | |||
| Quotes on the Dalian Commodity Exchange (DCE): | |||||||
| - LLDPE | 1 018 | 1 303 | 1 370 | 1 152 | 1 147 | 1 123 | |
| - Polypropylene | 1 104 | 1 341 | 1 327 | 1 138 | 1 066 | 1 045 | |
| - PVC | 955 | 1 425 | 1 354 | 910 | 853 | 809 | |
| For reference: | |||||||
| - Brent oil | 309 | 497 | 742 | 666 | 587 | 551 | |
From the comparison between the average price of December 2023 and the average annual price of 2020, it emerges that the financial prices of the plastic materials considered have maintained much lower price levels compared to Brent. In particular, among the thermoplastics listed on the Chinese stock exchange of the Dalian Commodity Exchange, the only one that recorded an increase in this four-year period was linear polyethylene (LLDPE) with a growth of 10%, much lower than that of Brent which grew by 78%. This difference is attributed to supply cuts by OPEC+ which has done everything possible to try to keep oil prices high.
Taking into account the specificities of the Chinese market, the DCE financial prices indicate that as regards the prices of the main thermoplastics, the 2020-2023 cycle closes with prices substantially returning to the levels at the beginning of the cycle, despite a significantly higher oil price.
The physical prices of thermoplastics on the EU market
In order to highlight different dynamics of the various prices based on the different characteristics of the thermoplastics considered, the following analysis has been distinguished between basic thermoplastics and technopolymers.
Basic engineering plastics include all those products that are widely used due to their simplicity of production, relatively low cost and good general properties, making them suitable for a wide range of applications
industrial.
Technopolymers, on the other hand, include all those high-performance polymers that offer superior properties such as heat resistance, chemical resistance, wear resistance, and/or improved mechanical properties compared to basic thermoplastics.
In commercial terms, commodity thermoplastics are generally cheaper and account for a larger share of the market than engineering plastics. Engineering plastics, however, are often chosen for specialized applications where their unique properties justify the higher cost.
Physical prices of basic thermoplastics
The following table shows the European customs prices of the main basic thermoplastics, expressed in euros per ton.
| Physical prices EU market: basic thermoplastics | |||||||
| (euros per ton) | |||||||
| 2020 | 2021 | H1-2022 | H2-2022 | 2023 | 2023-12 | ||
| Monomers: | |||||||
| - Ethylene | 679 | 976 | 1 307 | 1 119 | 1 030 | 987 | |
| - Propylene | 686 | 1 020 | 1 435 | 1 160 | 974 | 896 | |
| - Styrene | 639 | 1 172 | 1 594 | 1 252 | 1 092 | 1 172 | |
| Polymers: | |||||||
| - HDPE polyethylene | 942 | 1 369 | 1 682 | 1 513 | 1 261 | 1 238 | |
| - LDPE polyethylene | 972 | 1 650 | 1 935 | 1 569 | 1 293 | 1 407 | |
| - Linear polyethylene (LLDPE) | 941 | 1 534 | 1 784 | 1 549 | 1 265 | 1 236 | |
| - Polyvinyl chloride (PVC) | 755 | 1 272 | 1 705 | 1 399 | 1 031 | 934 | |
| - Virgin (PET) polyethylene terephthalate | 828 | 1 225 | 1 744 | 1 603 | 1 270 | 1 332 | |
| - Recycled (PET) polyethylene terephthalate | 678 | 854 | 1 284 | 1 357 | 956 | 833 | |
| - Polypropylene | 998 | 1 529 | 1 794 | 1 468 | 1 254 | 1 236 | |
| - Expanded polysterne | 1 071 | 1 868 | 2 561 | 2 069 | 1 747 | 1 855 | |
| - Non-expanded polysterne | 926 | 1 533 | 2 086 | 1 793 | 1 546 | 1 495 | |
| - Acrylic resins | 1 442 | 1 658 | 2 028 | 2 227 | 2 110 | 1 971 | |
| - ABS copolymers | 1 337 | 2 228 | 2 619 | 2 384 | 1 948 | 1 813 | |
| - SAN copolymers | 1 206 | 1 821 | 2 326 | 2 089 | 1 653 | 1 562 | |
The first element that emerges from the analysis of European physical prices is the strong difference between the financial prices of ethylene listed on the CME in Chicago and the physical prices on the European market. The reason is to be found in the peculiarity of the
American market where the supply of ethylene is very abundant given the high quantity of ethane gas available for its production.
The physical price that has recorded the greatest growth in the last four years is the price of styrene, which from 2020 to December 2023 recorded growth of more than 80%, due to the reduction in supply on the EU market, linked to the need for replace imports from Russia with imports from other countries. The sharp increase in the price of styrene supported the increases in two derived plastic materials: expanded polystere and non-expanded polystere which recorded growth of 73% and 61% respectively.
Among the products that report a more limited growth are Polyvinyl chloride (PVC) and SAN copolymers which record growth of 24% and 30% respectively.
Physical prices of technopolymers
The following table shows the trend in European customs prices of technopolymers, expressed in euros per ton.
| Physical prices EU market: technopolymers | |||||||
| (euros per ton) | |||||||
| 2020 | 2021 | H1-2022 | H2-2022 | 2023 | 2023-12 | ||
| Polyamide-6 (PA6) | 1 615 | 2 240 | 2 971 | 3 265 | 2 519 | 2 338 | |
| Polyamide-6,6 (PA6,6) | 2 751 | 3 440 | 4 408 | 4 576 | 3 768 | 3 152 | |
| Polycarbonates (PC) | 1 909 | 2 561 | 3 161 | 3 395 | 3 010 | 2 814 | |
| Polymethyl methacrylate (PMMA) | 2 223 | 2 647 | 2 988 | 3 211 | 2 696 | 2 637 | |
| Polytetrafluoroethylene (PTFE) | 10 035 | 10 630 | 12 513 | 13 170 | 15 148 | 14 667 | |
| Polimal Resin | 1 643 | 2 311 | 2 741 | 2 795 | 2 373 | 2 292 | |
| Acetal resin (POM) | 1 782 | 1 997 | 2 454 | 2 907 | 2 548 | 2 327 | |
The analysis of this last table highlights how the price levels of technopolymers are significantly higher than those of basic thermoplastics, in particular we focus on Polytetrafluoroethylene (PTFE), which in the last year has had a average price above 15 thousand euros per ton.
Another characteristic that emerges from the comparison between the prices of technopolymers and thermoplastics is that the former have recorded significant price reductions also in the second part of 2023, signaling their slower pace in the process of adjustment to new market conditions.
You may be interested in:

Hormuz Crisis and Food Packaging
Published by Pasquale Marzano. .
Food Packaging Paper Basic thermoplastics Should CostHow material composition drives different cost impacts [ Read all ]
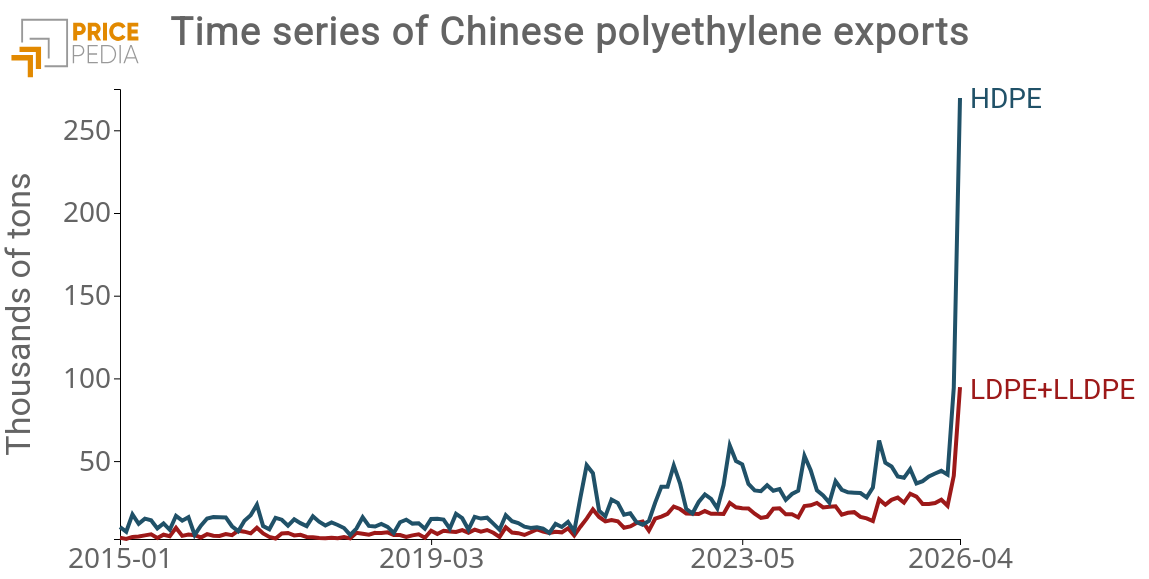
Polyethylene: the rise of Chinese exports in a market marked by supply shortages
Published by Luca Sazzini. .
Plastics and Elastomers Basic thermoplastics China in global commodity marketsChina eases global tensions over polyethylene [ Read all ]

Tensions in International HDPE prices
Published by Pasquale Marzano. .
Plastics and Elastomers Basic thermoplastics Price DriversComparing different sources to capture current developments [ Read all ]