Weather and crisis fears move prices
The phase of stability in commodity prices continues with some important exceptions
Published by Luigi Bidoia. .
Conjunctural Indicators Commodities Financial WeekThe stability of global industrial activity levels for almost two years is flattening the dynamics of commodity prices, with a few exceptions:
- reduction in oil prices;
- strong rebound in gas and electricity prices in Italy;
- rebalancing process of havena prices, after the strong growth in July and August;
- new phase of growth in the price of Arabica coffee.
ENERGY
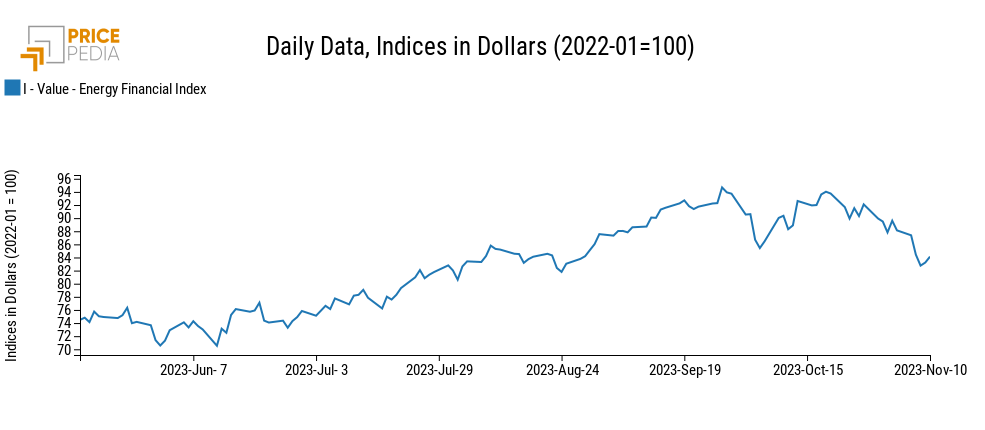
Driven by the reduction of oil prices and all its derivatives, the aggregate Energy Financial Price Index accentuated its downward phase, which started in mid-October, in the first days of the week. In the final days of the week, the index then stabilised.
PricePedia Financial Index of energy prices in dollars
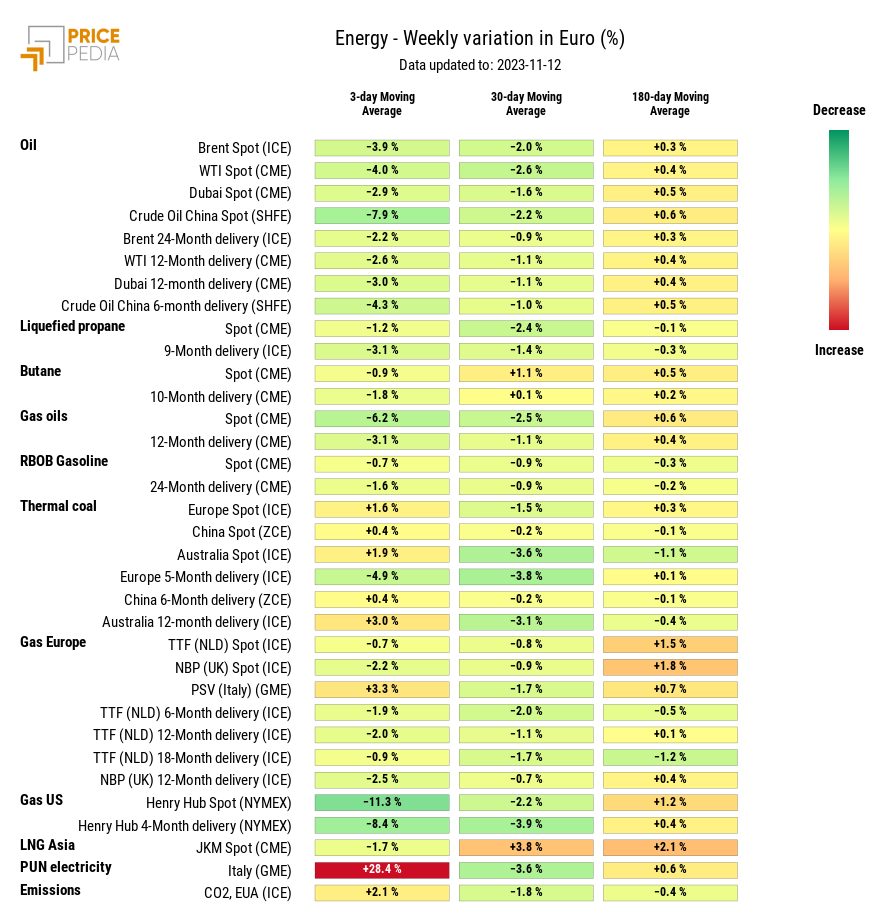
The energy heatmap shows an extended green area for the weekly changes in the 3-day moving average of all prices in the oil and its derivatives group. For these prices, the area of the 30-day moving average is also starting to turn green, indicating that the downward phase in prices is taking on consistency and persistence. The main driver of this bearish phase is fears of a global economic slowdown, led by China. It is unlikely, however, that this phase will continue, given that some Opec+ countries (Saudi Arabia and Russia, in particular) have announced that they will maintain the production cuts already in place in the coming months.
In the heatmap, the case of natural gas and electricity prices in Italy stands out clearly, with strong increases in the weekly rates of change of the 3-day moving average. These increases are, however, the result of a rebound from the abnormally low levels recorded by the two prices at the end of last week, when the price of gas at PSV and the electricity PUN had fallen below 40 and 80 euros/Megawatt-hour respectively.
HeatMap of energy prices in euro
PLASTIC MATERIALS
During the course of this week, the weak growth phase that had been characterising the Chinese financial price index broke down. The determinants are the same as those that pushed the price of oil down, namely fears that the global economic slowdown could turn out to be stronger than predicted by the major international institutions.
PricePedia Financial Index of Plastics in dollars.
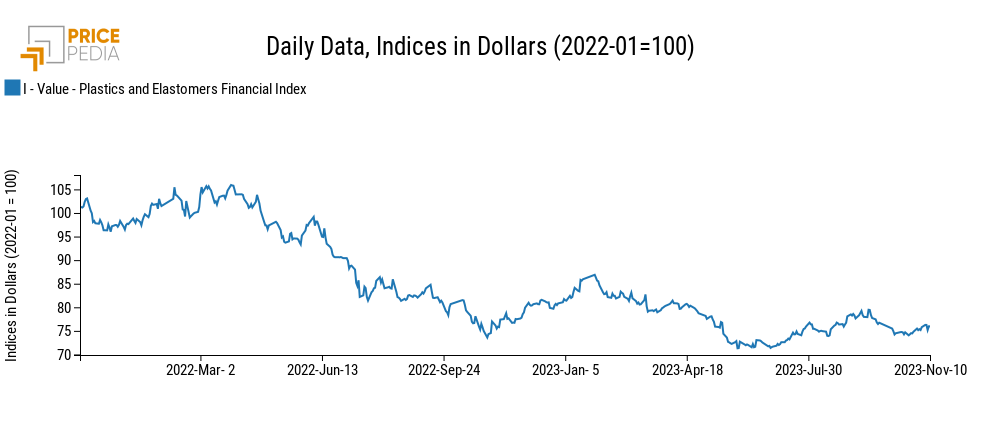
The heatmap below shows the euro prices of the plastics contained in the index.
HeatMap of plastics prices in euro
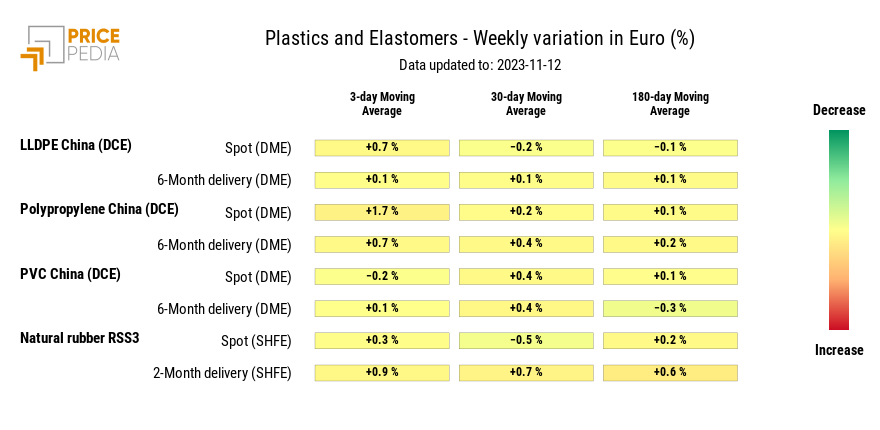
The heatmap clearly shows the absence of any significant weekly variation in both the 3-day, 30-day and 180-day moving averages, signalling the absence of any significant short- and medium-term trend.
FERROUS
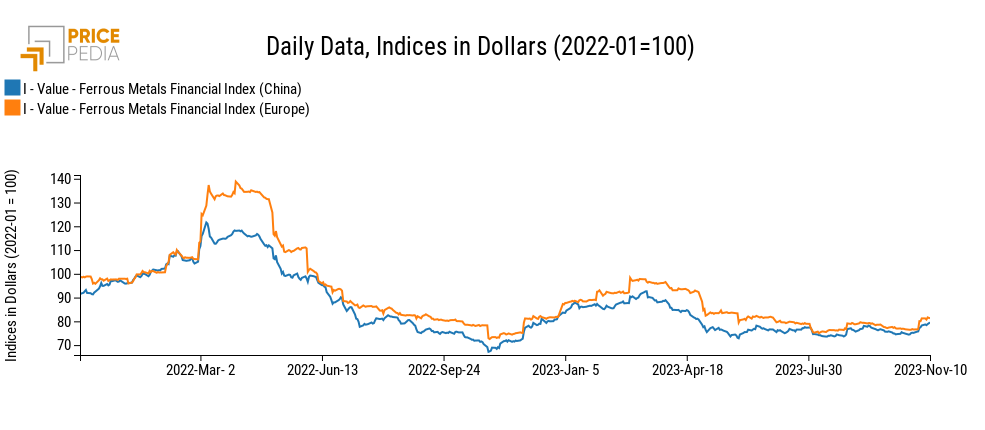
After last week's increases, the financial price indices for ferrous metal are also starting to flatten out.
PricePedia Financial Indices of ferrous metal prices in dollars
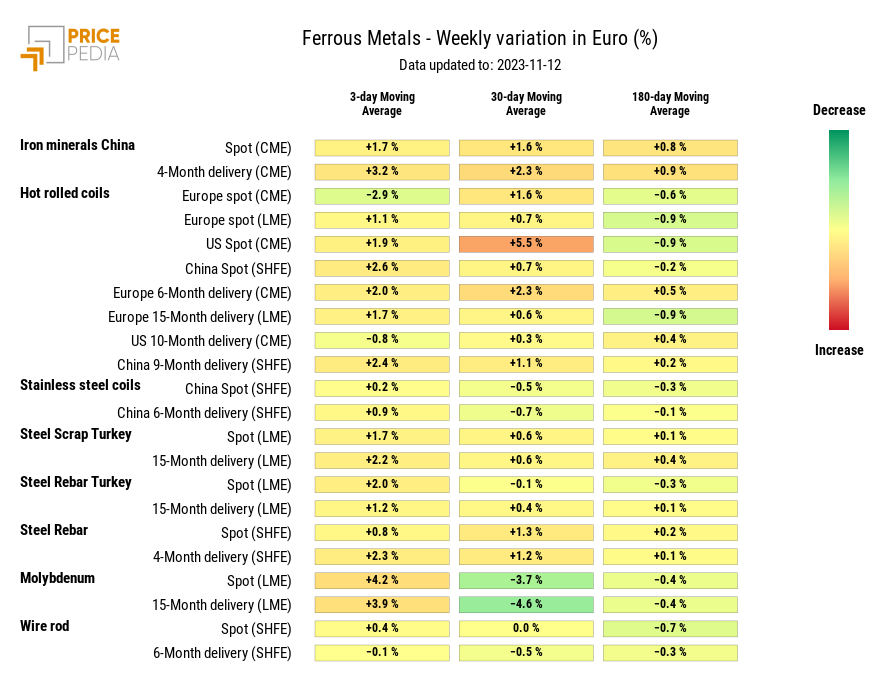
The heatmap shows general signs of weak increases, with the exception of the price of molybdenum, which shows a significant rebound after the slumps of recent weeks.
HeatMap of ferrous metal prices in euro
NON FERROUS
The financial price indices, London Metal Exchange (LME) and Shanghai Futures Exchange (SHFE), also interrupted their growth, aligning themselves with increasingly uncertain expectations that the world economy will return to a significant growth path as early as 2024.
PricePedia Financial Indices of non-ferrous metal prices in dollars
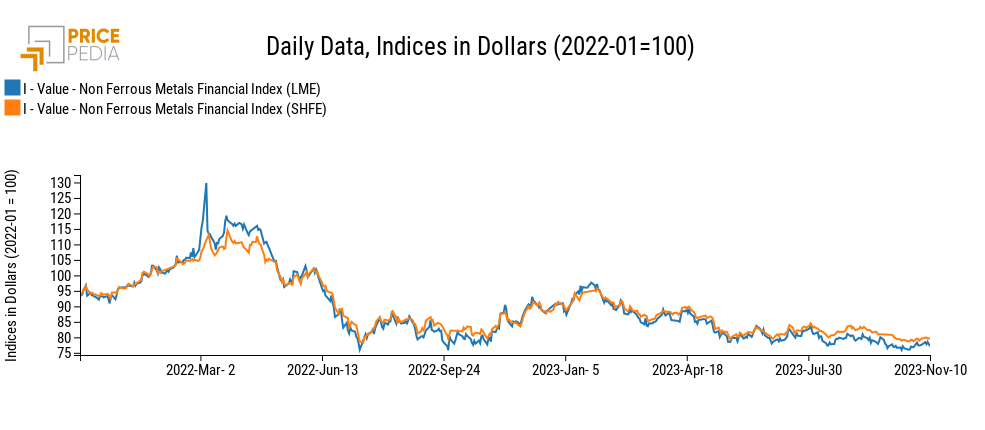
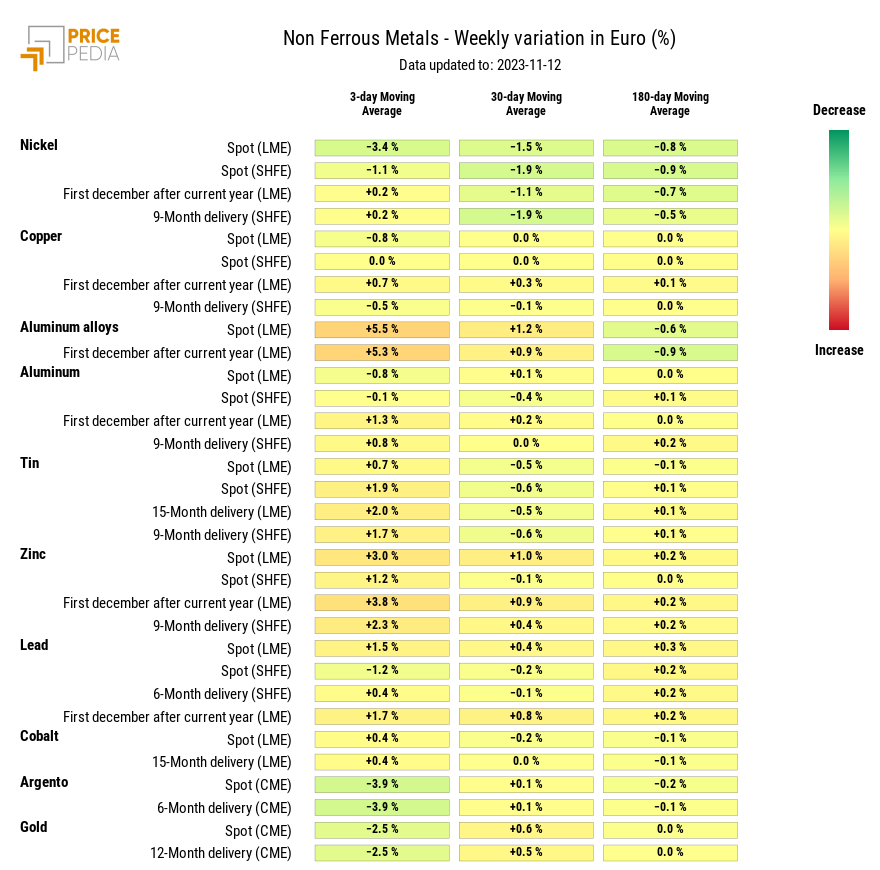
All non-ferrous prices, both in London and Shanghai, show very limited rates of change, with the exception of secondary aluminium alloys listed on the LME, which recover slightly from the downward trend of the last three months.
HeatMap of non ferrous metal prices in euro
FOOD
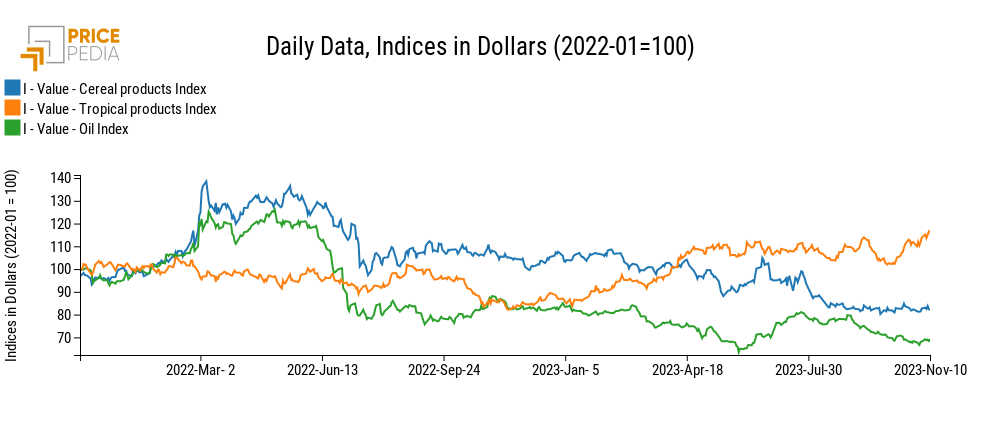
Within the food indices, the upward phase of the financial prices of tropicals continues, while the cereals and oils indices have been mostly moving sideways for several weeks.
PricePedia Financial Indices of food prices in dollars
CEREALS
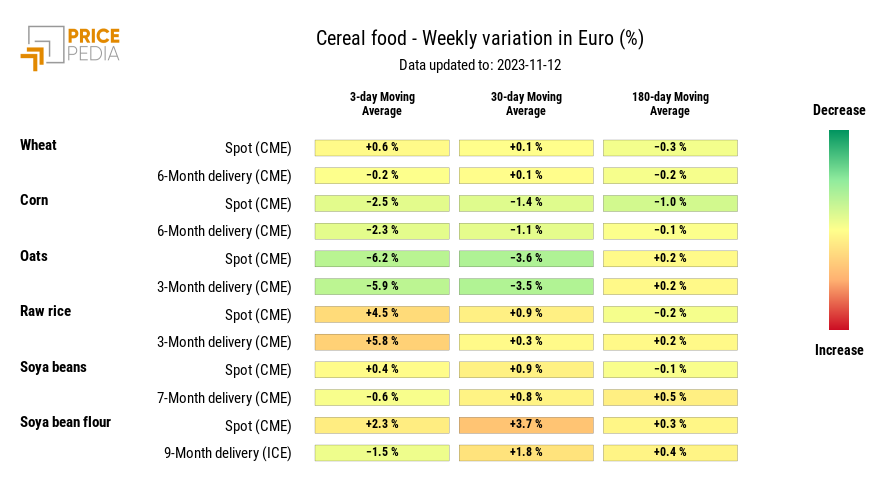
The cereal price heatmap shows a continuation of the decline in oat prices, which colours the weekly change in both the 3-day and 30-day moving averages bright green. The determinant of this price decrease is the restoration of the relative price of oats to other cereal substitutes, in particular wheat and corn. Between July and September 2023, drought fears and the reduction of stocks in North America had pushed up the price of oats to such an extent that it was even higher than that of corn and close to that of wheat. With these price differentials, part of the demand for oats shifted to wheat and especially corn.
HeatMap of cereal prices in euro
TROPICAL FOOD
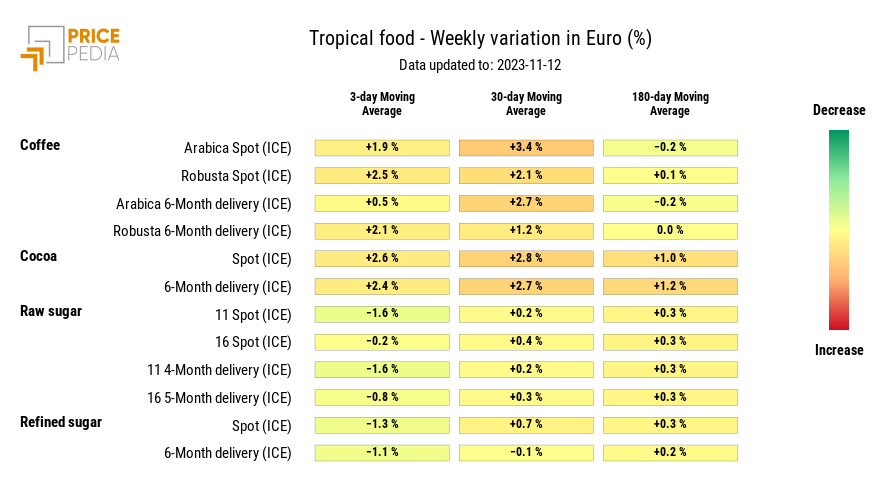
The upward phase in the price of arabica coffee continues to strengthen, bringing the weekly change in both the three-day and 30-day moving averages into the red.
The determinant of this upward phase in the arabica coffee price, which has lasted for more than a month, are the official stock statistics, which have fallen to a 24-year low. During 2023, in fact, the various drought periods have significantly reduced
Brazilian coffee production and consequently exports. Currently, Brazilian Arabica coffee exports are trending upwards
(compared to the corresponding month of 2022) of around 20%. The situation is, however, improving. Meteorological institutes
predict for Brazil an increase in rainfall and soil moisture that will favour the growth of coffee plants, suggesting higher yields for Brazil's coffee crop in the next two years.
HeatMap of tropical food prices in euro
FOOD OILS
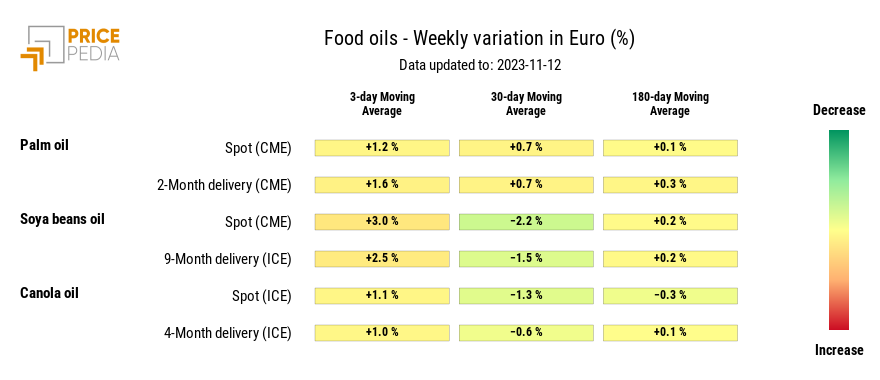
All oil prices show modest growth rates in the three-day moving average, and practically zero rates of change in the 180-day moving average, signalling the strong medium-term stability that characterises these prices.
HeatMap of oil prices in euro
