Commodity Prices: what to expect in the long-run?
Historical analysis of real commodity prices
Published by Pasquale Marzano. .
Energy Copper Natural Gas Non Ferrous Metals Analysis tools and methodologies
In the last two years, the Procurement function has faced a situation characterized by bottlenecks in global value chains, stressed by the pandemic, and by significant increases in raw material prices.
The current slowdown in global industrial production has radically changed the market conditions for many products. In many cases, prices began to decrease as early as the summer. There is a general consensus that the most acute phase of the slowdown/reduction in global activity levels will occur in the first half of 2023.
To evaluate the potential effects on raw material prices, it is essential to assess their current level. If, indeed, it is currently historically high, then it is likely that the reductions that will occur in the coming months may be particularly intense.
The following graph shows the trend of the Last Price index of the Total commodity (Europe), expressed in dollars.
Total Commodity Index (Europe)
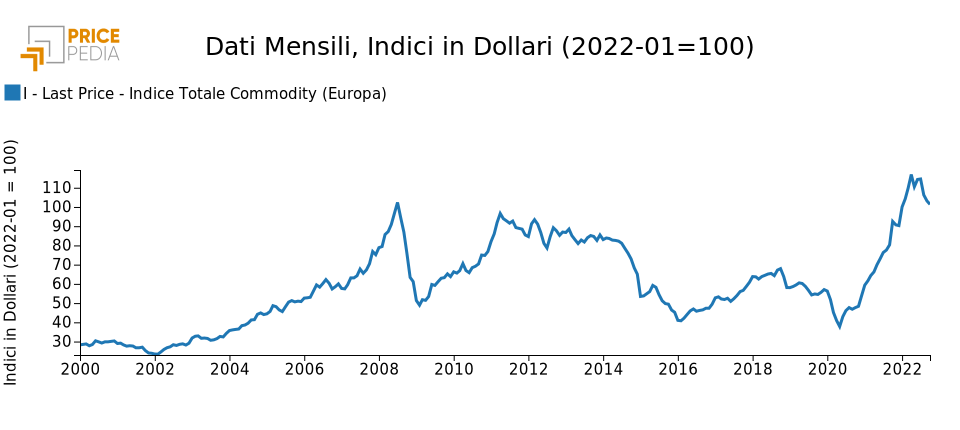
Starting from May 2020, the point of historical minimum touched during the Covid19 pandemic, commodity prices have undergone an incredible increase, unmatched in the last twenty years. This growth has led prices to reach the absolute peak in April 2022, which is 14% higher than the previous absolute historical peak recorded in July 2008.
Long-term analysis
Commodity prices follow long-term cycles that make a twenty-year analysis limited in judging their level historically. Furthermore, to compare price levels in very different periods, it is necessary to purify them from the effects of fluctuations in the prices of manufactured goods and services.
In this regard, the graph below reconstructs, starting from 19601, the PricePedia price index in dollars, relative to the commodity aggregate, which has been deflated considering the US Consumer Price Index (CPI) to obtain a measure of commodity prices not in nominal terms, but in real terms.
The graph also shows the maximum and minimum levels recorded by the average prices of commodities since 1960.
Total Commodity Index (Europe), index in Jan. 2022 US Dollars
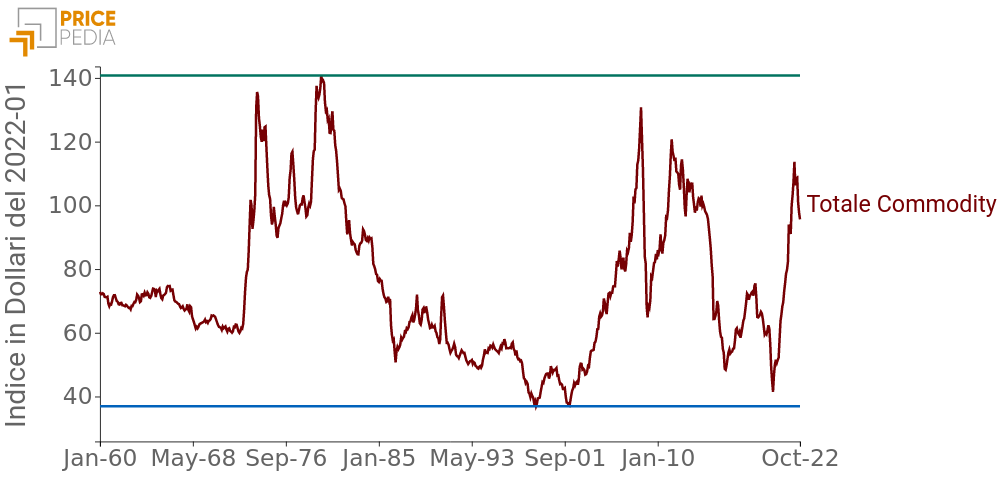
In light of this graph, the signal that emerges changes radically compared to what is obtained by focusing solely on the last 20 years.
In the period considered, the first significant increases in real commodity prices occurred concurrently with the oil shocks of 1973 and 1979. These shocks led real commodity prices to double the values of the previous decade. In the subsequent period, prices were characterized by a decreasing trend, bringing them to levels lower than those of the 1960s.
At the beginning of the new millennium, with China's industrialization and urbanization, commodity prices began to follow a growth path, driven by demand from the Asian giant. The growth continued until the months before the 2008-2009 financial crisis, but never reached the peak of the previous century.
Regarding the current phase of price increases, it is relatively lower compared to what was observed in previous cycles.
Copper
Within the same aggregate index, there are products that may present a different dynamic from that of the index itself. The following graph illustrates the price of copper expressed in dollars of January 2022 per ton.
Copper price, in Jan. 2022 US Dollars per Ton
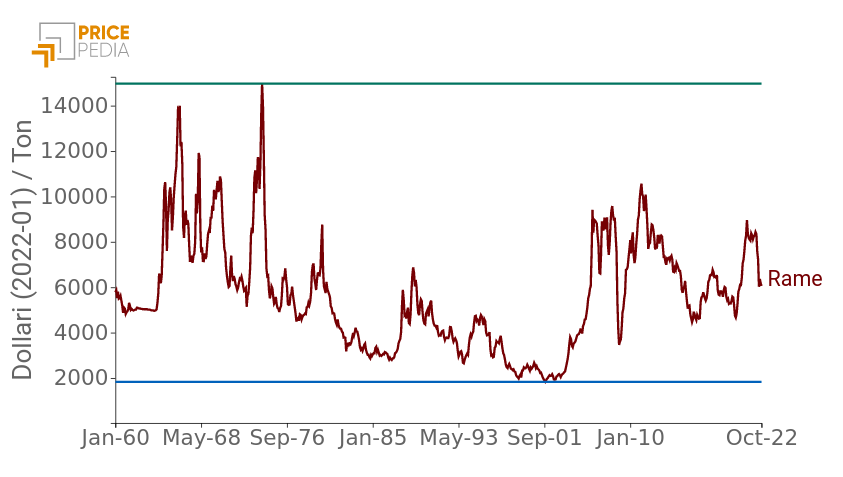
The dynamics of the copper price are similar to that observed for the aggregate index. The peak occurred during the first oil shock, while it is much lower in 1979. Furthermore, it is noted that before the oil shock of 1973, copper had reached a maximum level in the mid-1960s, a period of high demand for metals.
Also relevant is the decreasing trend that characterized the long-term dynamics until the early 2000s. This trend was interrupted by strong demand for industrial commodities, and therefore copper, from China.
In light of the long-term dynamics, also in this case, the current phase is relatively downsized.
Natural gas
A completely opposite case is that of European natural gas2, reported in the following graph.
Natural gas price, in Jan. 2022 US Dollars per MWh
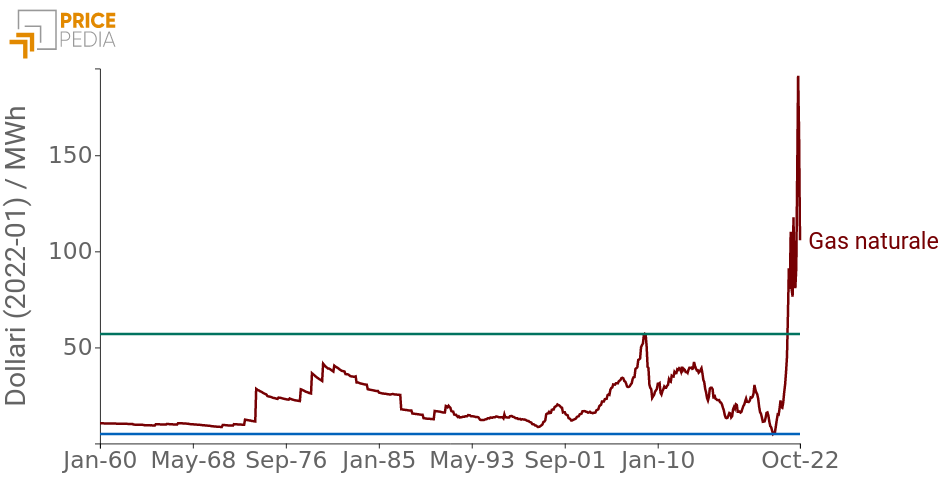
As can be seen from the graph, the current phase represents a breakpoint compared to the last 60 years of natural gas price history. Prices have reached anomalous levels, far higher than the increases recorded in the months before the Great Recession of 2008-2009. Furthermore, there have been no intense increases like those of copper in the 1960s and 1970s. This can be attributed to lower natural gas consumption compared to other more common fossil fuels.
More recently, levels remain high, although decreasing.
Conclusions
The analysis highlights the different dynamics of commodity prices in the current phase compared to what has occurred in the long term. On one hand, some products, such as copper, have returned, in real terms, to levels in line with historical values. On the other hand, products like natural gas are going through a prolonged phase of historically anomalous prices. For the latter, a more intense reduction is likely to occur in the coming months.
Do you want to stay up-to-date on commodity market trends?
Sign up for PricePedia newsletter: it's free!
[1] Data from January 1960 onwards has been reconstructed considering the ratio between the PricePedia Total Commodity Index (Europe) and the World Bank aggregate of energy and non-energy commodities.
[2] Data from January 1960 onwards has been reconstructed considering the ratio between the TTF Natural Gas (Netherlands) 1-month delivery and the price of natural gas in Europe from the World Bank.
You may be interested in:
PSV as a function of futures curves and global markets: a model for estimating the price of Italian natural gas
Published by Martina Gallus. .
Natural Gas Price DriversFrom short-term equilibrium to adjustment dynamics: an econometric model for analysing the evolution of Italy’s main gas benchmark [ Read all ]
Forecasting CO2 allowance prices in the European ETS market
Published by Martina Gallus. .
Energy Analysis tools and methodologiesUn approccio econometrico a due stadi [ Read all ]
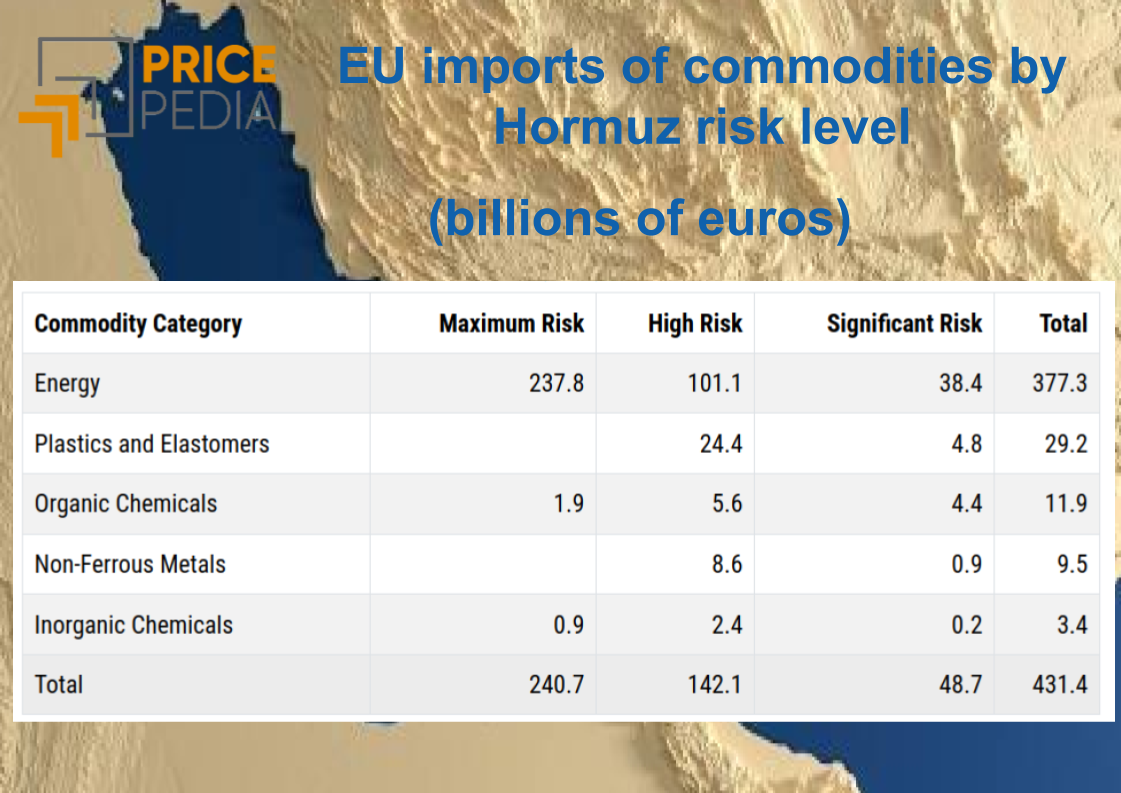
Supply Risk in the Event of a Closure of the Strait of Hormuz
Published by Luigi Bidoia. .
Energy Organic Chemicals Petrolchimica Strait of HormuzLe commodity europee maggiormente esposte al rischio Hormuz [ Read all ]