Storm on Gas and Electricity
Only a prolonged period of high prices will set in motion the forces for a rebalancing in the European gas and electricity market
Published by Luigi Bidoia. .
Energy Energy cost Natural Gas Electric Power Price DriversEurope's dependence on Russian gas was a strategic mistake that will lead to a profound change in the EU's trade and energy policy. However, these changes will take some time to produce significant effects. Meanwhile, the EU is at the mercy of Russian aggression whose sole aim is to do as much damage as possible to the EU economy. The price of gas at the TTF is the measure of the extent of these damages.
The month of July has now begun to close with a gas price which, on a monthly average, could exceed 170 euros per MWh. If we consider that in the 6 years between 2014-2019 the gas at the TTF recorded an average of 18.3 euros per Mwh, with a minimum of 10.9 and a maximum of only 27.9, there is a clear measure of the economic damage that Russia is facing. inflicting on the EU.
From the point of view of business decisions, the most immediate problem is to be able to assess the possible level of gas prices in the coming days until the end of March 2023. Since the price of gas descends that of electricity, an evaluation of the price of gas gas allows you to also have a measurement of that of electricity. An initial analysis on the possible price of gas in the winter of 2022-2023 can only start from an analysis of the probable supply and demand.
Demand
The graph presented here is taken from the "Gas MarketReport, Q3-2022" report published by the IEA at the beginning of July 2022. It contains the Institute's estimate of quarterly trend variations (yoy) of gas consumption in European industrialized countries in the last three years.
Quarterly variation rates of gas consumption in Europe (source: IEA)

In the second quarter of 2022, against an average price of gas of 102 euros per Mwh (equal to 4 times the average price of the second quarter of 2021), gas consumption decreased by 15%. In the third quarter, gas prices are expected to be between 150 and 200 euros per MWh. Although the short-term price elasticity of gas demand is limited, this price level is likely to further increase the reduction in consumption. The drop in consumption in the winter of 2022-2023, induced by high gas prices, could be close to 20% compared to consumption in 2021. This reduction would be close to that of 15% (calculated with respect to the average winter consumption of the last 5 years), the subject of the recent agreement for the voluntary reduction of gas consumption between EU countries between 1 August 2022 and 31 March 2023. The adjustment of demand induced by the current gas price levels would therefore make it possible to achieve, via economic behaviors, the savings hypothesized by the European Commission to be achieved through voluntary actions by the various countries.
Supply
Gas consumption in Europe is highly seasonal, while supply, under normal conditions, tends to be constant, tied to the capacities of existing infrastructures (gas pipelines and LNG regasifiers). To align supply and demand over time, the gas is stored in special facilities in the lower-consumption summer period and then withdrawn in the higher-consumption winter period. The offer for the winter period therefore largely depends on how much gas has been previously stored.
The graph below shows the quantity of gas present in the various days in the gas storage facilities of the EU countries. To make this indicator more readable, the gas stock has been compared to the annual gas consumption in 2020. The index therefore measures what percentage of annual consumption can be met with escorted gas only.
Dynamics of gas stock levels in the EU as a percentage of annual consumption in 2020

From the graph it is clear that the winters of 2019 and 2020 were faced with very high gas stocks, equal to 47% of annual EU consumption. Conversely, the winter of 2021 was tackled starting with stocks corresponding to only 37% of total consumption, 10 points lower than the stocks of the two previous winters. Due to high consumption in the first part of 2021, inventories were low throughout 2021, starting the phase of exponential price increases.
The Reserves situation
In order to assess how the storage phase is progressing this year, it may be useful to compare stock levels on three precise dates in different years:
- on April 1st, when the winter season ends and stocks are at their lowest point;
- on July 24, to get a measure of the situation at this time of the year;
- on October 1st, when stocks are at their highest before the start of the winter season.
The graph below shows the stock levels in the three dates considered from 2014 to today.

This graph shows how the stock levels at the beginning of the 2021 summer season were higher than those of a few previous years. However, the higher consumption, not offset by higher purchases, led to inventory levels in July lower than in all previous years, reaching October 1 with particularly low inventories.
The situation in 2022 started worse than in 2021, but then it recovered so much that on July 24 the stocks were higher than those of 2021, although significantly lower than the two-year period 2019-2020. Even in the hypothesis of a functioning of the Nord Stream 1 gas pipeline by only 20%, the fate of European gas on 1 October could be higher than they were last year. This is not to say that there will not be a shortage of supply over the course of the winter, but this shortage could be compensated for by the lower expected demand.
The situation in the different countries
The stock level is of course not the same for different European countries. On 24 July the stocks of 4 countries (Germany, Holland, France and Italy) represented 65% of the total EU stocks. A review of the stock situations of these four countries may therefore be useful. Also in this case, in order to make the situations of the different countries comparable, we have compared the stocks to their annual consumption in 2020.
Gas storage levels as a percentage of annual consumption
| 2019 | 2020 |
 |
 |
| 2021 | 2022 |
 |
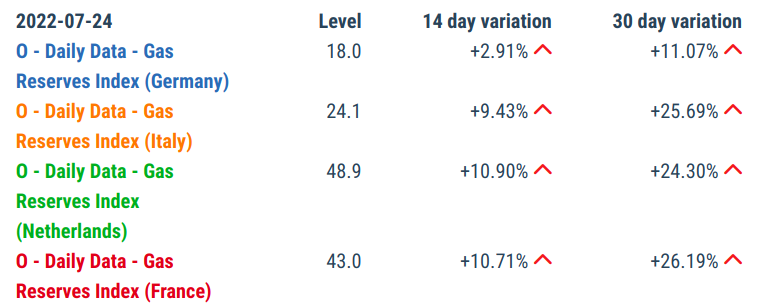 |
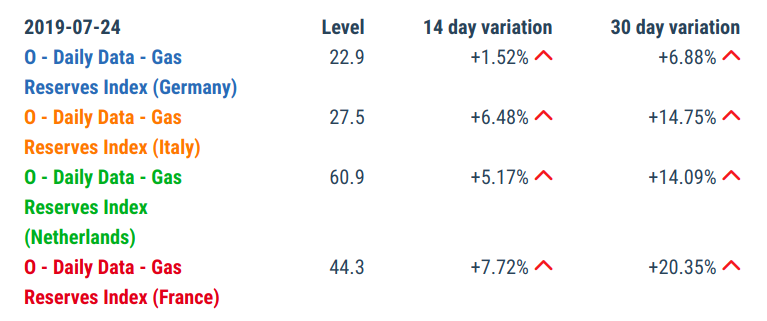
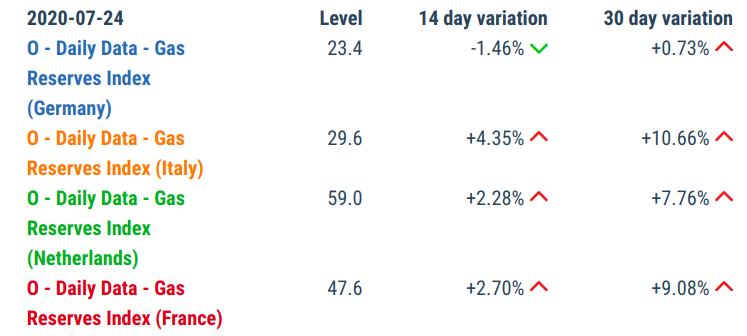
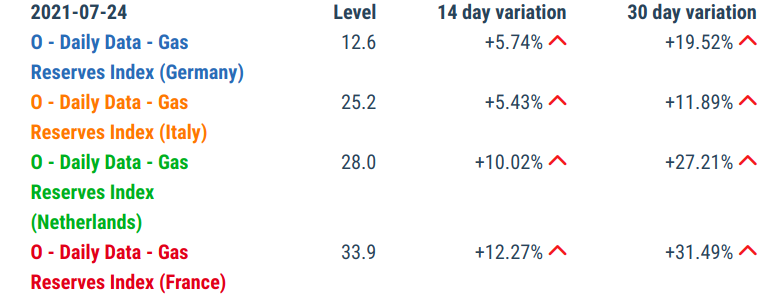
The four tables show the level of gas stocks (as a percentage of annual consumption in 2020) in the four countries considered, on 24 July of the four-year period 2019-2022. In addition to the level of stocks on the date considered, the table reports its variation over the previous 14 and 30 days, providing a measure of the speed at which stocks are accumulating. The analysis of these data points to these facts:
- France and the Netherlands had a significantly higher inventory policy than Italy and, above all, Germany;
- despite their policy, the build-up of stocks in France and the Netherlands was also very late in the summer of 2021;
- particularly strong was the delay in 2021 in Germany's restocking. On 24 July 2021, gas stocks at German storage facilities were sufficient to cover only 12% of Germany's annual consumption. It is evident that, last summer, Germany was not worried about a possible shortage of gas, also in light of the forthcoming opening of Nord Stream 2;
- in July of this year, the situation is aligned with the best years for France and the Netherlands, which will be able to face next winter with relative optimism;
- the situation is serious for Italy. Even if the storage areas are 71% full, this does not mean that the available gas is less than a quarter of the gas consumed in a year;
- the situation is even more serious for Germany, which has gas stocks to cover only 18% of consumption and particularly low growth rates, equal to only 11% in one month. At this rate, Germany will face the winter with only slightly higher stocks than it faced last winter, but with limited if any arrivals from Russia.
Conclusions
The reduction in gas demand in Europe this year, mainly induced by the anomalous price level, will be offset by the lower supply of Russian gas. Germany will be the country with the largest deficits, followed by Italy. In this situation, FTT prices are unlikely to drop significantly from current levels. At the same time, however, prices higher than 200 euros per MWh are not imaginable, except for very short periods, even in the presence of a total blockade of supplies from Russia. In this case, the adjustment would take place via a reduction in demand, also through the suspension of the activities of the most energy-intensive sectors. A difficult winter is therefore expected on the side of gas prices (and consequently electricity), before prices produce significant effects on the structure of demand and the search for alternative sources will allow the complete replacement of Russian gas.
You may be interested in:
Forecasting CO2 allowance prices in the European ETS market
Published by Martina Gallus. .
Energy Analysis tools and methodologiesUn approccio econometrico a due stadi [ Read all ]
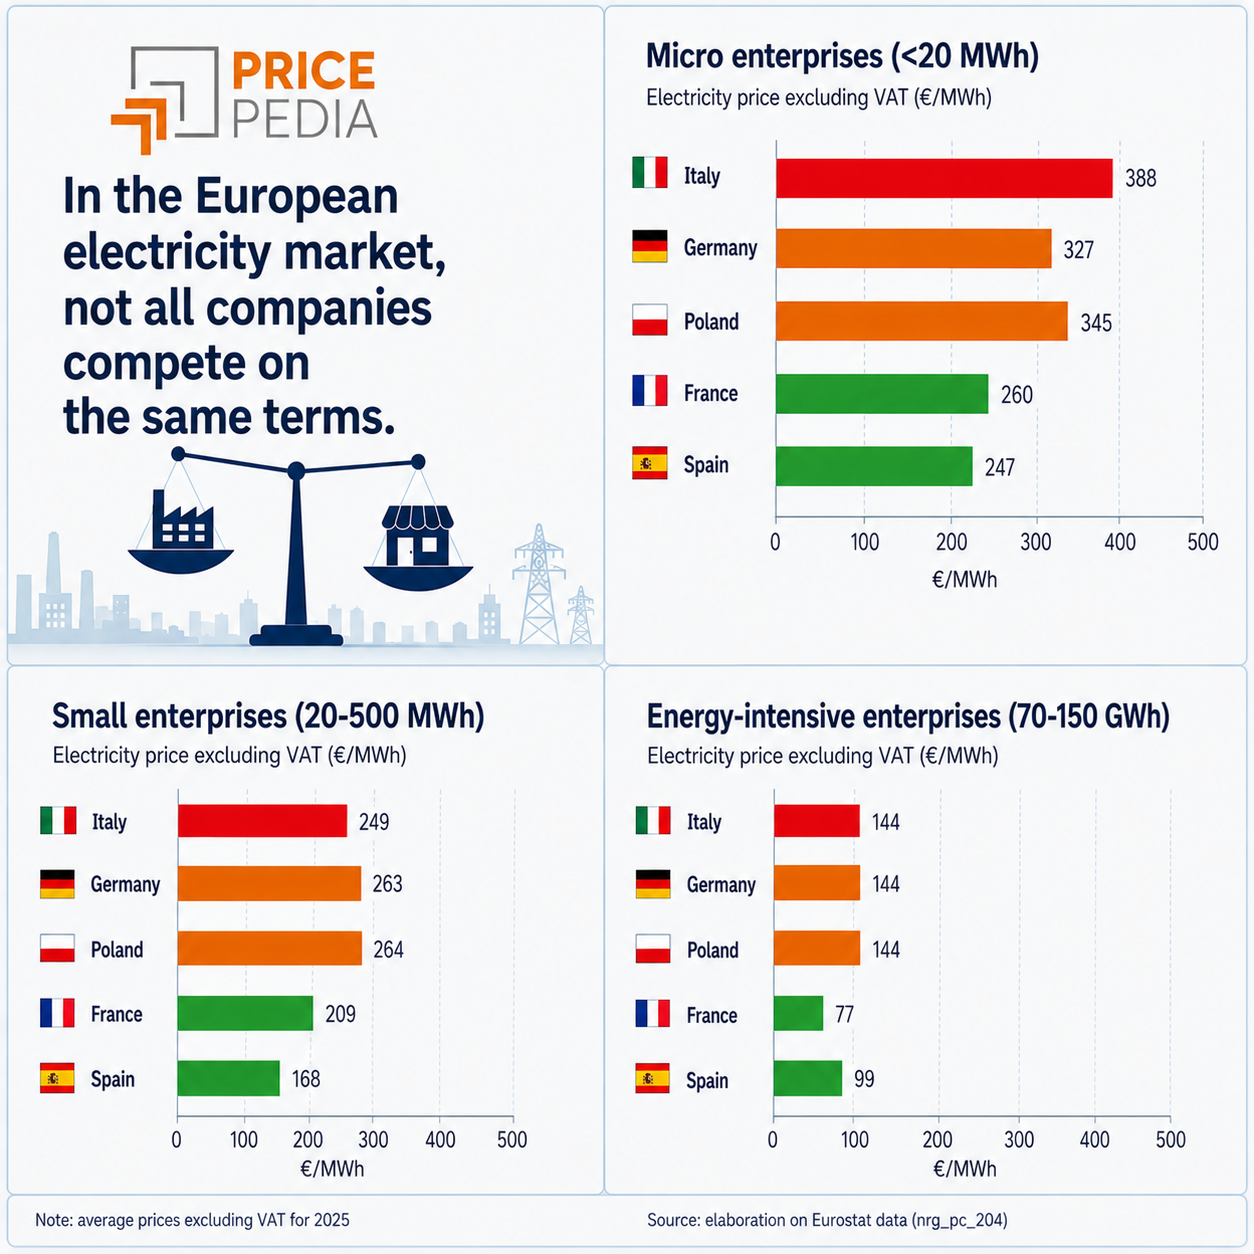
How Much Do European Companies Pay for Electricity?
Published by Luigi Bidoia. .
Electricity's National Single Price Electric Power Price DriversPrezzi diversi non solo tra mercati nazionali, ma anche in base ai livelli di consumo [ Read all ]

Increasing raw material prices for food packaging
Published by Pasquale Marzano. .
Energy cost Food Global Economic TrendsThe hierarchy of energy shock transmission is confirmed [ Read all ]