Fundamentals of the gas market
The analysis of the dynamics of financial gas prices in Europe allows to reveal the evolution of the underlying fundamentals
Published by Luigi Bidoia. .
Natural Gas Forecast Price DriversThe market efficiency hypothesis (EMH: Efficient-Market Hypothesis) is one of the pillars of the financial economy 1. In its strong form, it argues that financial market prices reflect both public and private information of agents. If this is true, then
it is possible to extract from the dynamics of a financial price, or of a group of interrelated financial prices, the evolution of the fundamentals that have conditioned that market.
This article focuses on the dynamics of the price of natural gas in Europe. This can be useful for two purposes. The first is a predictive purpose: understanding the past evolution of gas price fundamentals can help to chart their probable evolution in the future. The second has a policy purpose: in the hypothesis of the introduction of a gas price cap, the identification of the factors that led the market to exceed this ceiling can provide indications on the degree of inefficiency and distortion of the market that could derive from its introduction.
The recent history of gas prices can be broken down into 4 phases:
- resumption of the global industrial cycle between summer 2020 and spring 2021;
- from summer 2021 to 7 December 2021;
- from December 2021 to the Russian invasion of Ukraine;
- from the beginning of the conflict to today.
Resumption of the world industrial cycle: strong growth in demand for gas
In this first phase, the price of gas increased due to the recovery in demand, to which supply did not immediately align itself. This is evident when comparing the price of gas at the European TTF with the price of gas in Asia, measured by the one-month future of the price of liquefied gas recorded by Platts on the Korean and Japanese markets.
Financial gas prices from October 2019 to July 2021
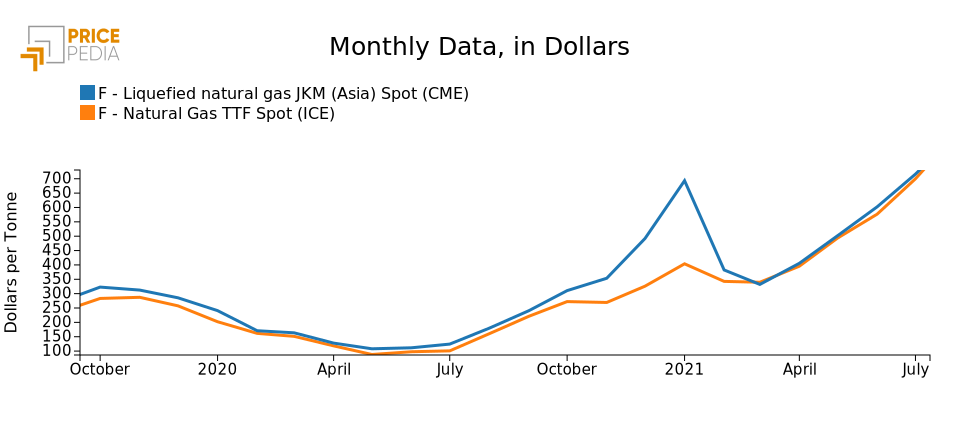
In the early part of the recovery, the two gas prices were very much in line and increased at a similar pace. until October. Subsequently, the price in Asia recorded a real acceleration, signaling the greater intensity of the recovery underway in Asia. In the spring of 2021, the two prices returned to align themselves, continuing their growth supported by ever-increasing demand. The dynamics of these prices reflect:
- the strong relationship between the two markets, due to the purchases made by Europe on the liquefied gas market;
- the increase in prices caused by a growth in demand greater than that of supply.
From summer to December 7, 2021: low gas reserves
This is the phase in which the demand on the European market was particularly strong because demand for the replenishment of reserves was added to the demands for consumption. These, in fact, turned out to be at the end of summer 2021 at a very low level, never experienced before, which prompted distribution companies to increase their purchases.
Financial gas prices in the second half of 2021
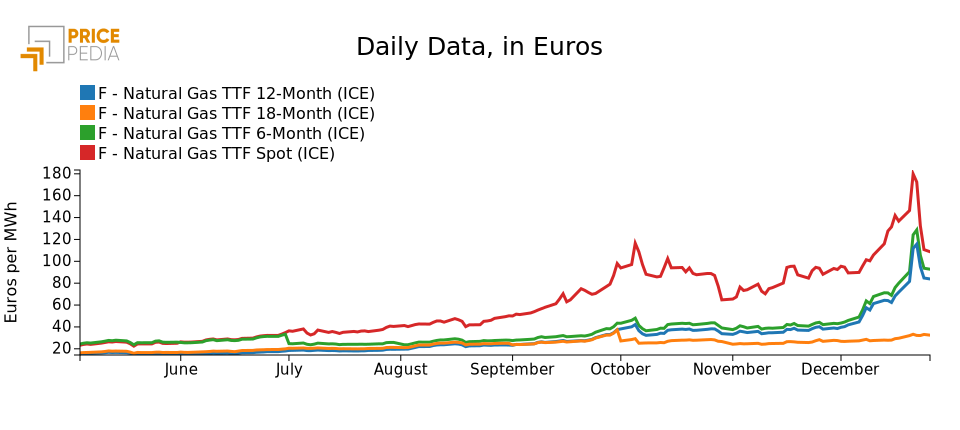
The pressure of higher demand in the short term is evident if one compares the spot price, which is growing strongly, with the prices of futures at 6, 12, 18 months, which were relatively stable in the period considered. During the summer of 2021, gas prices at the Dutch TTF started to rise again; but while the increase for contracts with a maturity of 6 months and beyond was modest, the increase for spot prices was disruptive. Subsequently, in October 2021, when the winter phase began and the heating systems were turned on, the reserves in Europe were less than 40% of average annual consumption, compared to a level of 50% considered optimal. In this situation, the spot price has exceeded the level of 100 euros per Mwh, with a difference of over 50 euros towards contracts for deliveries beyond March 2022.
It is clear that until 7 December 2021 the market did not express any concerns for the medium to long term. The only tension at this stage concerned spot prices.
The anomalies of December 2021: signs of the future conflict
On 7 December 2021 the gas market at the TTF begins to signal the emergence of a new fact, as shown in the graph below.
Financial gas prices in the months leading up to the Russian invasion of Ukraine
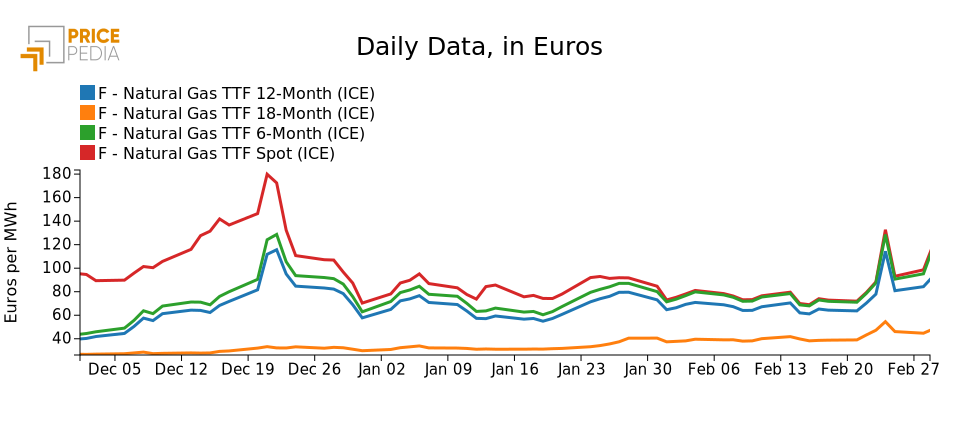
Between 6 and 8 December, in just two days, 6 and 12-month contracts recorded an increase of 30% and 29% respectively, far exceeding the 12% increase recorded by the spot price. On the contrary, in the same two days the 18-month contract remained substantially unchanged, at a level below 30 euros, not different from the pre-pandemic gas prices. In the following days, the entire price structure of contracts up to 12 months continued to grow
up to 21 December to record peaks of 180, 129 and 116 euros / Mwh respectively for the spot price, at 6 and 12 months.
Interpretation of Results
There was no consensus among analysts in identifying the fundamentals that led to these peaks. Some commentators blamed this growth on France's lower net exports of electricity due to maintenance of some nuclear power plants.
But this interpretation is unsatisfactory for at least two reasons:- the collapse of France's electricity trade balance had already occurred in November, a month before the sharp rise in gas prices;
- the greater rise in the prices of 6 and 12-month contracts leads to looking for the cause in non-short-term factors, with a time horizon of at least one year.
The strong effect, with a specific impact in a few days and the price reaction of all contracts up to 12 months,
suggests the emergence of other factors. It is likely that at the beginning of December some operators began to understand that behind the Russian army exercises on the border with Ukraine, the Nord Stream 2 blockade and the Russian gas supply to Germany through the Yamal pipeline problems of a geopolitical nature were hidden which could have led to tensions between the EU and Russia, making EU imports of gas from Russia difficult at least.
Another sign in this direction is the significant growth in this phase also in the price of the 18-month contract, which went from € 28 in December 2021 to € 39 in the days preceding the Russian invasion.
The Russian invasion: the expected duration of the conflict drives the price structure
At dawn on February 24, 2022, Russian tanks entered Ukraine for a "special military operation" that should have ended in a few days with the dismissal of the Zelensky government and its replacement by a pro-Russian government.
Traders at the TTF appeared to believe in a quick outcome of the conflict, so much so that the price of gas jumped on the 24th, but
then it returned below 100 euros the following day.
Ukraine's ability to organize resistance soon changed this scenario, leading to spot and 6-month price hikes that seemed unstoppable.
Financial gas prices since the Russian invasion of Ukraine
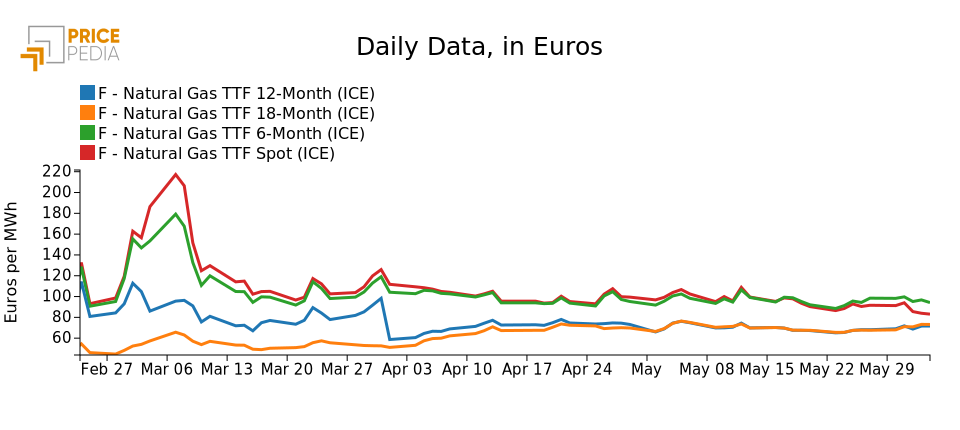
On March 7, 2022, gas prices, spot and 6-month, reached the astonishing level of 217 and 179 euros / Mwh, and then fell again in the following days, however, both remaining above 100 euros.
The analysis of prices by contract expiration indicates some significant changes on the expected duration of the conflict:
- at the beginning of the hostilities, the operators at the TTF on average believed that the conflict could last a year or more, but less than 18 months;
- in April, the expected duration of the conflict shrank to less than a year, after the Russian army was forced to withdraw from the region of Kiev and the Russian government have changed their objectives, reducing them to the conquest of the Donbass and the Odessa region.
Finally, a new change took place in May, clearly signaled by the prices: those within 6 months have passed from a backwardation situation (when prices for future maturities are lower than spot prices) to a contango one (when prices for future maturities are higher than spot prices). The reason is clear if we also consider the graph below which compares the price of European gas at the TTF with the price of gas in the United States at the Henry Hub.
Comparison of gas prices in Europe and the USA
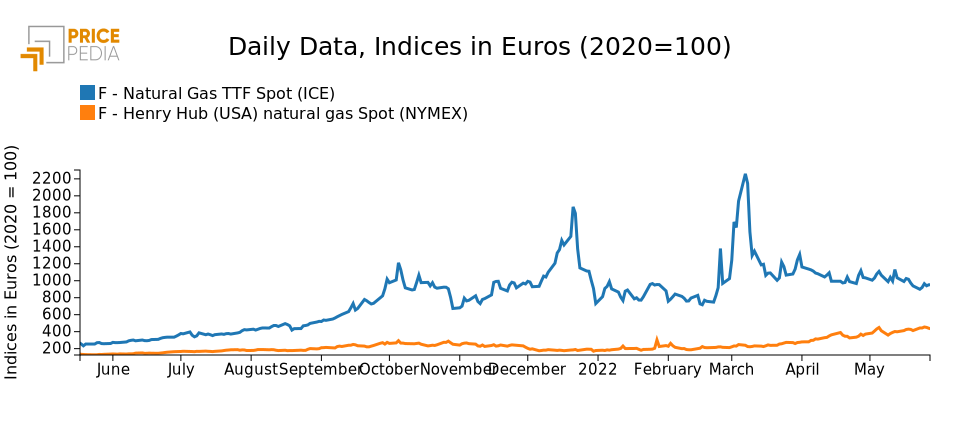
The different dynamics of the gas price between the two sides of the Atlantic from the beginning of April are evident from this graph: the European price fell by -22%; the American one increased by + 57%. This different dynamic is due to expectations of a sharp increase in exports of liquefied gas from the United States to Europe. In fact, on March 25, President Biden announced an agreement that will lead the US liquefied natural gas (LNG) industry to supply an additional 15 billion cubic meters to Europe by the end of 2022, and then grow to 50 billion. of cubic meters, equal to about one third of the European Union's gas imports from Russia in 2021.
Conclusions
From the point of view of forecasts, this analysis suggests a possible phase in the near future
gradual, but slow, decrease in the price of gas in Europe
in relation to the growth of EU LNG imports,
followed by a rapid halving of prices
when a sustainable end to the conflict can be seen. However, this scenario is subject to many risks, all in the direction of new possible flare-ups in prices.
From a policy point of view, the hypothesis of introducing a price ceiling, for example at 80 euro / Mwh, is entirely reasonable, because in the past the market has exceeded this threshold only due to exceptional events with likely effects. negligible in terms of market efficiency. At the same time, the high risks associated with the conflict suggest assigning a non-low probability to the
possible return of new price flares,
making the roof an appropriate "insurance".
You may be interested in:

PricePedia Scenario for June 2026
Published by Pasquale Marzano. .
Forecast ForecastPrices of input materials in 2026–2027 between higher energy costs and tighter supply conditions [ Read all ]

Iron ore price forecast for 2026 - 2027
Published by Luca Sazzini. .
Ferrous Metals Forecast ForecastWhat are analysts' forecasts for iron ore prices? [ Read all ]

LME zinc price forecast
Published by Luca Sazzini. .
Zinc Forecast ForecastAnalysts agree on the future trend of zinc prices [ Read all ]