Cocoa price transmission along the Supply Chain
A measure of the link between the physical and financial markets
Published by Pasquale Marzano. .
Food Cocoa Price DriversIn the article Cocoa prices: moving toward normalization?, it was shown how cocoa bean prices recorded historically high increases over the past two years. In the most recent phase, they have started to decline from the exceptionally high 2024-2025 levels toward relatively lower values.
This trend has affected the two financial benchmarks traded on the Intercontinental Exchange (ICE) for deliveries in New York and London, which drive the price movements along the cocoa supply chain, from cocoa beans to liquor (mass), butter, and cocoa powder.
Cocoa Derivatives
Before analyzing the relationship between financial and physical prices, it is useful to briefly describe the main cocoa derivatives.
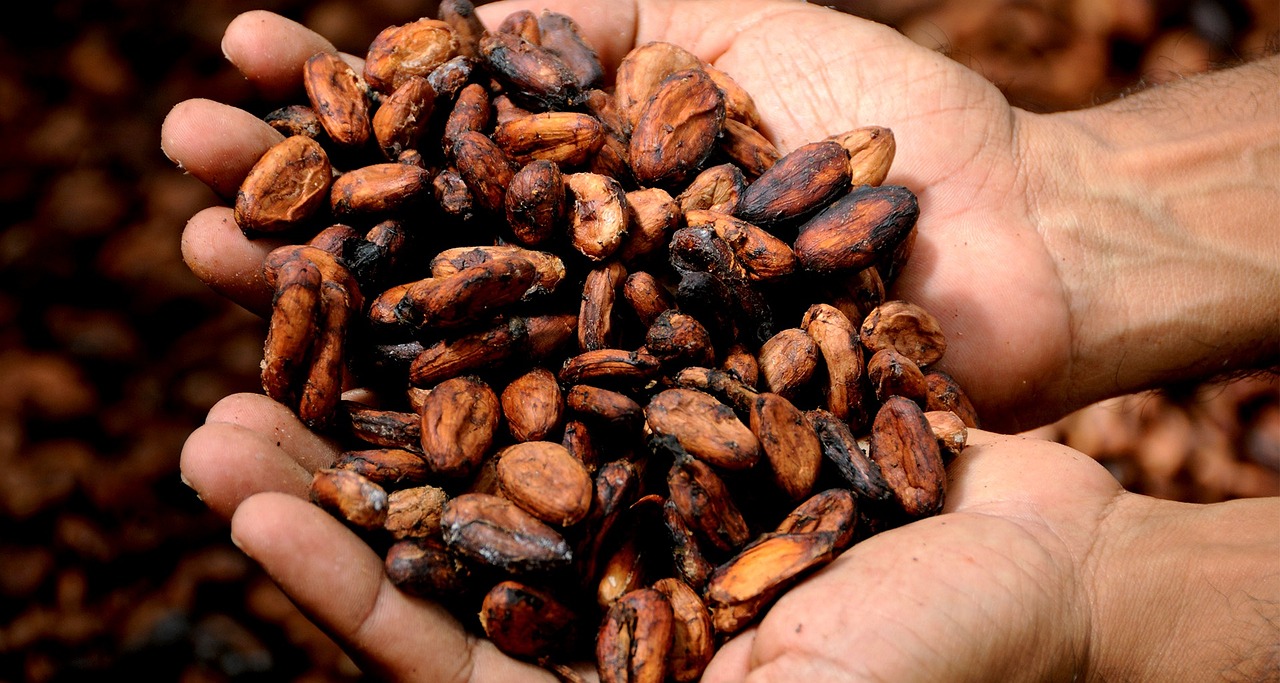
The first product obtained from roasting and grinding cocoa beans is the non-defatted cocoa mass, which contains both fat (over 50%) and cocoa solids. Through further processing, such as grinding and hot pressing, it is possible to extract from this mass the cocoa butter, used both in the food industry for chocolate production and in sectors such as cosmetics and pharmaceuticals.
Cocoa powder, on the other hand, is obtained by grinding the defatted cocoa mass, which represents the residual component left after cocoa butter extraction.
European customs-based prices of cocoa beans and their derivatives[1], expressed in euros per ton, are shown in the following table.
Cocoa and Derivatives: Prices in EUR/Ton
| 2015 | 2016 | 2017 | 2018 | 2019 | 2020 | 2021 | 2022 | 2023 | 2024 | 2025 | |
|---|---|---|---|---|---|---|---|---|---|---|---|
| D-Last Price EU-Cocoa beans | 2799 | 2880 | 2305 | 2120 | 2250 | 2429 | 2412 | 2475 | 2924 | 5536 | 7699 |
| D-Last Price EU-Cocoa mass (not defatted) | 3726 | 3907 | 3284 | 2941 | 3066 | 3249 | 3255 | 3369 | 3965 | 7147 | 12273 |
| D-Last Price EU-Defatted cocoa mass | 2252 | 2397 | 1878 | 1513 | 1605 | 1707 | 2069 | 2593 | 2822 | 3677 | 5923 |
| D-Last Price EU-Cocoa butter | 6016 | 5930 | 5415 | 5025 | 5123 | 5297 | 4701 | 4537 | 5366 | 12036 | 20374 |
| D-Last Price EU-Unsweetened cocoa powder | 2244 | 2556 | 2289 | 2067 | 2092 | 2239 | 2487 | 2786 | 3083 | 4102 | 6815 |
The highest average price levels are those of cocoa butter, justified by its product properties and its uses across several high value-added industries. The second most expensive product is the non-defatted cocoa mass, whose prices are around 30% lower than those of butter.
As for the other two products, defatted cocoa mass and unsweetened cocoa powder, their price levels are lower than those of the other cocoa derivatives.
The table highlights the sharp price increases that occurred in 2024-2025, affecting the entire supply chain. While cocoa beans rose by +89% in 2024 and +39% in the average of the first nine months of 2025, the most intense increase was recorded by cocoa butter (+120% in 2024 and +69% in 2025). Non-defatted cocoa mass also experienced strong annual growth during the same period, equal to +80% and +61% respectively. For defatted cocoa mass and unsweetened cocoa powder, price growth was relatively milder, though still above +30% in 2024 and +60% in 2025.
A measure of the relationship between financial and physical cocoa prices
To provide a first quantitative measure of the link between the physical and financial cocoa markets, the following table reports the linear correlation matrix of prices.
Cocoa and Derivatives: Price Correlation Matrix

The matrix shows the strong correlation between physical market prices and financial quotations, especially among the various derivative products along the supply chain.
In particular, the financial benchmark tends to be more closely correlated with upstream products, namely, cocoa beans (high correlation of 0.95) and non-defatted cocoa mass (0.91). Cocoa butter prices also show a strong correlation with the financial benchmark (0.90). Moreover, cocoa butter is highly correlated with non-defatted cocoa mass prices (0.97).
Moving downstream along the supply chain, the relationship with the financial price becomes weaker: this is the case for defatted cocoa mass and unsweetened cocoa powder, which show correlations below 0.80. This weaker correlation helps explain the lower intensity of price increases recorded for both products, especially during 2024.
Do you want to stay up-to-date on commodity market trends?
Sign up for PricePedia newsletter: it's free!
1. Prices of cocoa derivative products will be published in PricePedia alongside the October 2025 price update.
You may be interested in:

Eggs and Egg Products: the upward price phase continues
Published by Pasquale Marzano. .
Food Price DriversCustoms prices measure the transmission of increases along the egg processing chain [ Read all ]
Food commodities: moving toward price normalization?
Published by Pasquale Marzano. .
Food Forecast ForecastDiverging trends by product category in 2026-2027 [ Read all ]

The should cost of Panettone
Published by Pasquale Marzano. .
Food Should Cost Should CostDo raw material cost dynamics justify recent panettone price inflation? [ Read all ]