Niobium: poor recyclability and high dependence on Brazilian supply
Analysis of global dynamics in the ferro-niobium market
Published by Luca Sazzini. .
Non Ferrous Metals Ferroalloys Critical raw materialsNiobium is a strategic metal predominantly used in the form of ferro-niobium, a ferroalloy employed in the production of HSLA (High-Strength Low-Alloy) steels, which account for around 90% of global niobium demand. The main application sectors for these steels are construction and the automotive industry, particularly electric vehicles. Niobium is also used in the production of superalloys for the Oil & Gas sector and, to a lesser extent, in stainless steel.
Although there are several metals capable of replacing niobium in the production of HSLA steels—such as vanadium, molybdenum, tantalum, titanium, and tungsten—these are also considered critical commodities for the European Union.
Over the past twenty years, global demand for niobium has increased significantly due to the expansion of electric mobility and is expected to continue growing, supported by forecasts of a recovery in Chinese demand. Global production has also risen considerably over the years and is expected to grow by 2.5–3% annually until 2030.
Despite expectations of supply expansion, the European Union remains highly vulnerable in terms of supply security. Domestic production is virtually nonexistent, and the entire demand depends on highly concentrated external supplies, exposing Europe to a high supply risk.
This fragility is further exacerbated by an extremely low and, in most cases, non-functional recycling rate. The niobium contained in scrap is neither recovered nor separated as a pure metal, as this is not economically viable: in the final alloys in which it is used, niobium is present in very low concentrations, often below 1%, making the separation process technically complex and economically unfeasible.
Although no comprehensive and systematic public data on niobium recycling exist, it is estimated that globally, as well as in Europe, functional recycling (with separation of niobium from other metals) is below 1%, while non-functional recycling may cover up to 20% of apparent consumption.
The lack of domestic production and the heavy reliance on external suppliers are pushing the European Union to promote new, more effective recycling strategies in order to reduce supply risks.
In this article, we will conduct a preliminary analysis of global niobium trade, highlighting the main global exporters and EU suppliers, before examining price trends in the regional markets of the European Union and China.
Commodity and Trade Flow Analysis of Niobium
Niobium occurs in nature in the form of minerals, the most common of which are pyrochlore and columbite. Its global production is highly concentrated, with Brazil alone accounting for over 90% of world supply, followed by Canada with about 7%.[1]
Commercially, niobium is traded almost exclusively in the form of ferro-niobium, a ferroalloy containing between 60% and 70% niobium by weight. As mentioned earlier, this alloy is mainly used in the production of HSLA steels, which typically contain between 0.02% and 0.1% niobium. As a result, the concentration of niobium in the final product is generally below 1%, with rare exceptions reaching up to 5%.
The chart below shows the evolution of global niobium trade by weight, from 1995 to 2024.
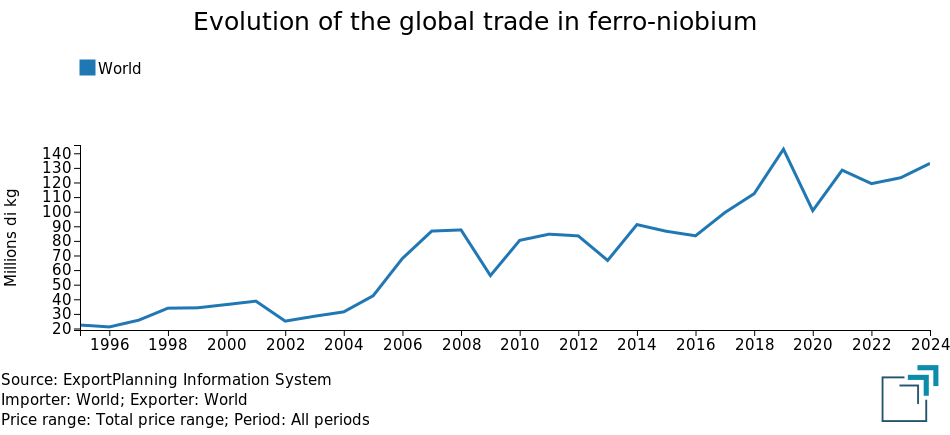
The chart analysis shows a growing trend in global ferro-niobium trade. In 1995, global production stood at around 22 thousand tonnes; by 2000, this figure had nearly doubled, reaching 40 thousand tonnes. Since then, growth has further accelerated, with production reaching 133 thousand tonnes in 2024—more than tripling the levels of the early 2000s.
The growth in supply did not result from the entry of new exporting countries into the market, but from the expansion of those already present in the last century. The global supply of ferro-niobium thus remains highly concentrated.
The following chart shows the top 10 global exporters of ferro-niobium in 2024.
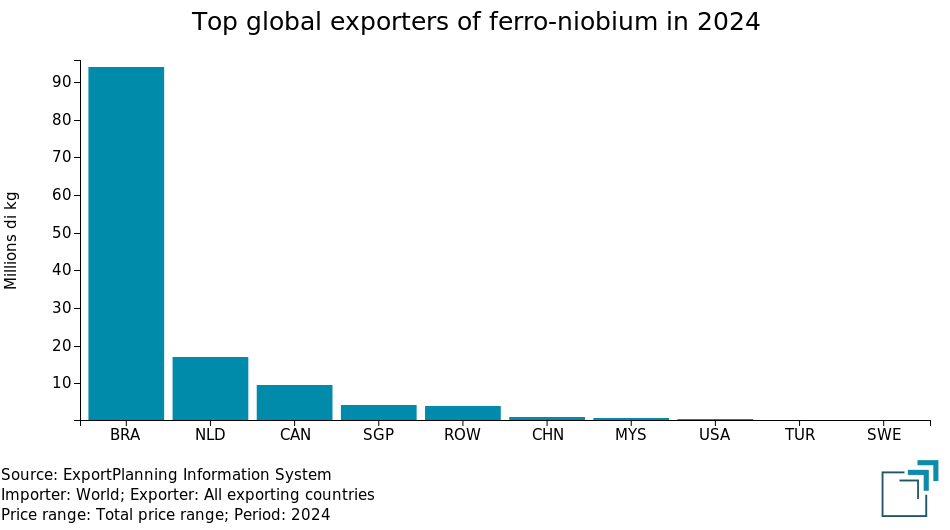
In 2024, Brazil alone exported 94 thousand tonnes of ferro-niobium, accounting for over 70% of global trade that year. The Netherlands ranks as the second-largest exporter, with 17 thousand tonnes exported. However, the Netherlands is not a producer of ferro-niobium but rather a net importer: in 2024, it imported over 19 thousand tonnes, making it the second-largest importer globally. Excluding the Netherlands, which primarily acts as a re-export hub, the next largest exporter is Canada, which exported around 10 thousand tonnes in 2024.
Given Brazil's undisputed leadership in the global ferro-niobium market, European supply is also heavily dependent on this country.
The following chart shows the top 10 ferro-niobium suppliers for the European market in 2024.
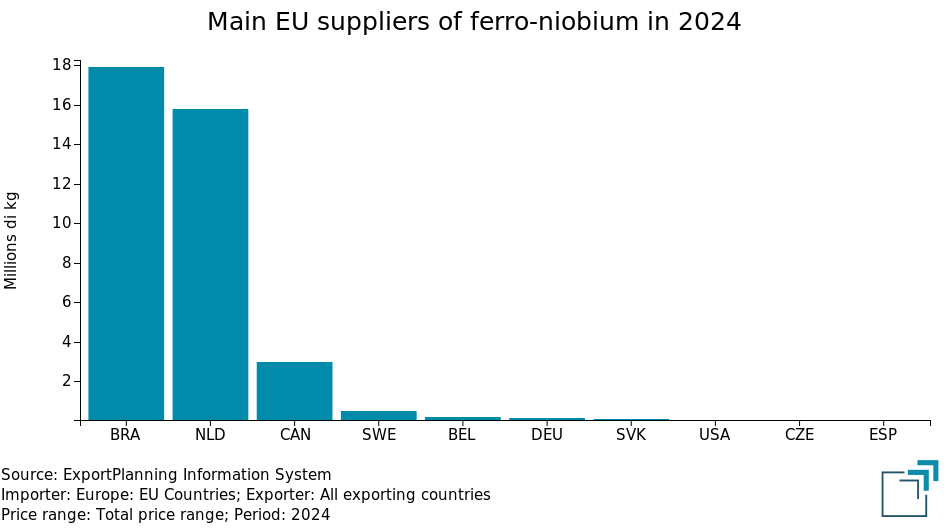
From the chart analysis, it is clear that the European Union’s main suppliers coincide with the world’s largest ferro-niobium exporters. The EU imports about half of its needs directly from Brazil, amounting to roughly 18 thousand tonnes. The Netherlands follow, covering about 40% of EU supplies, but only act as an intra-European re-export hub, as they are also net importers of ferro-niobium. Canada ranks third, supplying about 8% of European demand.
Excluding the Netherlands, the EU’s dependence on Brazilian supply is evident. Brazil holds a dominant position in ferro-niobium production and exports, and any disruption in its supply would result in a severe shortage of ferro-niobium not only in the European market but globally.
Do you want to stay up-to-date on commodity market trends?
Sign up for PricePedia newsletter: it's free!
Price Analysis
The chart below presents a comparison between the historical series of CIF prices of ferro-niobium recorded by customs in the European Union and China, the world's leading ferro-niobium importer, which in 2024 imported over one-third of total supply.
CIF customs prices of ferro-niobium in the EU and China, expressed in euros/tonne
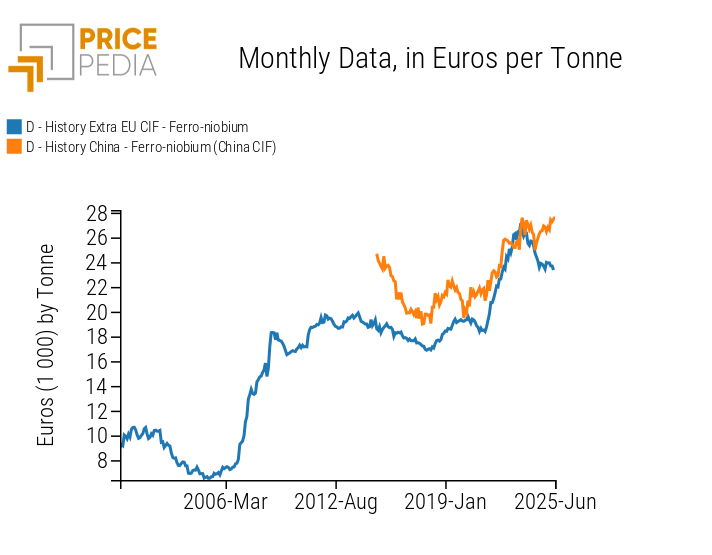
Three key points emerge from the chart analysis:
- The high price level of ferro-niobium, with Chinese prices nearing €28,000/tonne. This level is consistent with the alloy's composition, given its high niobium content, typically between 60% and 70%.
- The strong alignment of price trends between China and the EU, with Chinese prices averaging about 8% higher than European ones.
- The significant price increase since the beginning of the 2000s, in line with the rise in global demand over the past twenty years. Since 2000, CIF prices in the EU have more than doubled, rising from about €10,000/tonne to an average of nearly €26,000/tonne from early 2025 to the present.
Summary
Over the past twenty years, both global trade and price levels of ferro-niobium have more than tripled. Global supply is heavily concentrated in Brazil, which in 2024 produced over 90% of the niobium mined worldwide and exported about 70% of global ferro-niobium supply.
EU demand is entirely dependent on Brazilian and Canadian supplies, as there is no significant domestic production and the non-functional recycling rate stands at around 20%. However, the functional recycling rate capable of recovering pure niobium is estimated to be below 1%.
The analysis of CIF prices revealed a very similar trend between the European and Chinese markets, with the latter consistently showing slightly higher prices—around 8%—due to higher transport costs from Brazil and a higher niobium concentration in the ferroalloys.
[1] Source: U.S. Geological Survey (USGS): Mineral Commodity Summaries 2025.
