The effect of renewables on the Italian hourly electricity price
An econometric analysis on the period January 2023 to June 2025
Published by Emanuele Morelli. .
Energy Electricity's National Single Price Electric Power Machine learning and EconometricsIn recent years, the hourly price of electricity in Italy (PUN) has shown increasing volatility, with more frequent episodes of zero or very low prices, even in the presence of high gas and CO₂ costs. (See the article How renewable energy is changing the hourly electricity prices in Italy)
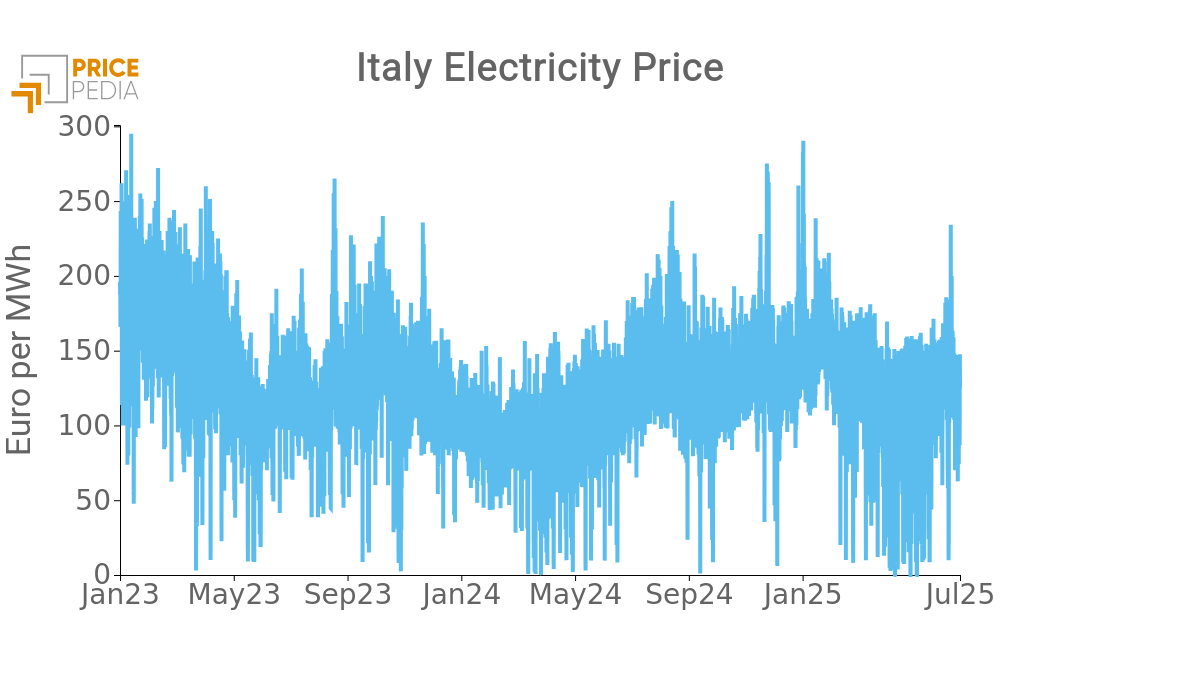
This phenomenon raises fundamental questions: what are currently the main determinants of the PUN? And how significant is the impact of renewable energy production, especially when it is concentrated in specific areas of Italy?
In this article, we offer a quantitative answer through a statistical model estimated on tens of thousands of hourly observations, spanning from January 1st, 2023 to the first half of 2025. The results provide valuable insights for understanding and forecasting the evolution of the Italian electricity market.
The econometric model
The analysis begins with a detailed reconstruction of hourly PUN data starting from 2023, integrated with:
- daily prices of natural gas and CO₂ certificates;
- total hourly electricity demand in Italy;
- the percentage share of electricity from renewable energy sources (RES), both at national and zonal level.
The estimated model is a linear regression, where the hourly PUN is explained as a function of gas prices (in €/MWh) and CO₂ certificate prices (in €/ton), electricity demand (corresponding to Italy’s electricity requirement) expressed in GWh, the share of RES at the national level, and a dummy variable that takes the value 1 when, in at least one of the Italian electricity zones (North, Central-North, Central-South, South, Calabria, Sicily, and Sardinia), the hourly production from non-dispatchable RES exceeds 50% of the local production; otherwise, it takes the value 0.
Non-dispatchable renewable sources include technologies such as wind and photovoltaic solar (along with the “run-of-river” hydroelectric technology, which refers to a type of plant that harnesses the natural flow of a watercourse to generate energy), whose output directly depends on weather conditions and cannot be directly controlled or adjusted in real time. Unlike dispatchable renewable sources (such as reservoir hydro, geothermal, or biomass), it is not possible to increase or reduce their supply based on demand. When, in a given zone, production from these sources exceeds half of the total electricity production, a price compression effect can occur, due to the abundance of energy with a very low marginal cost (close to zero).
Want to stay updated on commodity market trends?
Subscribe for free to the PricePedia newsletter!
Model estimation results
The table below reports the estimated coefficient values and their standard errors for the variables included in the model. The results are statistically very robust, confirming the validity of the hypothesized relationship.
| Variable | Coefficient | Standard Errors |
|---|---|---|
| GAS | 1.5227 | 0.017 |
| CO₂ | 0.3330 | 0.014 |
| DEMAND | 1.3325 | 0.017 |
| RES SHARE | -0.9110 | 0.012 |
| NON-DISP. RES DUMMY | -3.8668 | 0.358 |
The regression’s ability to explain the variability of the hourly PUN is equal to 68%, a satisfactory result considering the high volatility of this variable. The interpretations of the effects of each regressor on the hourly PUN are as follows:
- Gas: every increase of 1 €/MWh in gas raises the PUN by 1.52 €/MWh on average;
- CO₂: each additional euro per ton increases the PUN by 0.33 €/MWh;
- Demand: the effect of demand is positive and equal to 1.33 €/MWh for each additional GWh of consumption. The average price elasticity of the PUN with respect to demand variations implied by this value is 0.40. This means that a 10% change in hourly electricity demand leads, on average, to a 4% change in the hourly price;
- RES Share: each additional percentage point of renewables reduces the PUN by about 0.91 €/MWh;
- Dummy: when in at least one zone the share of non-dispatchable RES exceeds 50%, the PUN decreases by an additional 3.87 €/MWh.
It should be noted that the estimated model is particularly suitable for capturing the medium-to-long term effects of variables on the hourly electricity price. To investigate short-term dynamics, such as sudden peaks, rapid reversals, or lagged effects, additional econometric specifications are needed, such as dynamic error correction models.
Conclusion
The hourly electricity price in Italy remains strongly linked to gas and CO₂ markets, but the analysis clearly shows how the growth of renewable energy production is also becoming an increasingly relevant factor. In particular, the presence of non-dispatchable renewables concentrated at the zonal level produces very significant effects on the price. This confirms the usefulness of considering geographic indicators, and not just national averages, in PUN forecasting models. In an energy transition context, where the RES share will continue to grow, the adoption of statistical models that account for these new dynamics will become an essential tool for all electricity market operators.
You may be interested in:

The impact of renewables on the PUN remains limited in the long run
Published by Luigi Bidoia. .
Electricity's National Single Price Electric Power Price DriversSono ancora poche le ore in cui le fonti rinnovabili determinano il prezzo [ Read all ]

How the Italian electricity market has changed over the last 6 years
Published by Luigi Bidoia. .
Energy cost Electricity's National Single Price Electric Power Energy Transition Price DriversConsumi e mix produttivo: le basi per comprendere l’evoluzione dei prezzi [ Read all ]
PUN price: neither inverse decoupling nor a CO2 effect
Published by Luigi Bidoia. .
Electricity's National Single Price Electric Power Analysis tools and methodologiesLa quota di produzione da fonti rinnovabili spiega in larga misura il recente aumento del prezzo dell’energia elettrica. [ Read all ]