Physical Prices, Financial Prices, and Risk Transmission: An Analysis of Correlations
Quantitative Analysis of the Correlations Between Physical and Financial Prices
Published by Cristina Luca. .
economic analysis Analysis tools and methodologiesTo identify which EU customs prices may be influenced by the volatility of correlated financial prices, we calculated simple correlations between physical prices and all the spot financial prices monitored by PricePedia. Financial prices were compared with physical prices both concurrently and with a one- and two-month lag to capture any potential leading effect of financial markets on real price movements.
Out of all possible combinations of physical and financial price series, we only considered correlations with a coefficient greater than 0.90. This threshold was adopted to focus the analysis on statistically strong relationships, consistent with the hypothesis of volatility transmission between markets. A correlation this high allows us to concentrate on relationships that may also be relevant from an operational standpoint, making it easier to identify useful signals for risk management. Additionally, this filter reduces the likelihood of including weak relationships that do not offer meaningful insights into real price connections.
From Statistical Evidence to Economic Interpretation
Following this quantitative selection, we applied a qualitative filter based on the economic consistency between the two variables. Only those relationships compatible with the production structure and supply chain logic of the physical good were deemed acceptable. For example, the correlation between the price of stainless steel and nickel was included, as it is well known that the price of stainless steel is strongly influenced by the price of nickel, a key component.
Conversely, we excluded some correlations, such as that between the customs price of tissues and the financial price of rough rice: despite a coefficient above 0.90, there is no production or commercial link between the two products. These cases highlight the existence of purely random relationships, which may lead to misinterpretation if the analysis relies solely on numerical criteria. Indeed, economic analysis requires not only statistical identification of a link but also its economic justification: in the absence of a market-consistent explanation, even a high correlation can be misleading.
In addition to these, there are also spurious correlations, which are not entirely random but result from indirect effects or shared external factors. For instance, we found a strong correlation between the physical price of sunflower oil and the financial price of palm oil. In reality, this relationship reflects the fact that the physical price of sunflower oil is influenced by the physical price of palm oil, its direct competitor in both food and industrial markets. In this case, the correlation with the financial price of palm oil is mediated by a third factor and does not represent a direct, independent relationship.
Description of Results
The following table presents a selection of cases of simple correlations between PricePedia physical prices and financial prices exceeding 0.90.
Simple Correlations Between Physical and Financial Prices
| Physical Price | Financial Price | Lag (months) | Correlation (ρ) |
|---|---|---|---|
| Copper wires (section > 6 mm) | Copper (CME), price/Pound | 0 | 0.9966 |
| Unrefined silver | Silver (CME), price/Troy Ounce | 0 | 0.9958 |
| Crude oil (price/barrel) | Brent (ICE), price/barrel | 0 | 0.9952 |
| Aluminum alloy strips for cans | Aluminum (LME) | 1 | 0.9883 |
| Nickel sulphates | Nickel (LME) | 1 | 0.9833 |
| Coffee (unroasted) Brazil | Arabica Coffee (ICE), price/Pound | 2 | 0.9788 |
| Cocoa beans | Cocoa (ICE) | 2 | 0.9557 |
| Recycled kraft paper | Recycled paper OCC (NOREXECO) | 0 | 0.9332 |
| Zinc ores | Zinc (LME) | 0 | 0.9202 |
| Lead oxides | Lead (LME) | 1 | 0.9095 |
The table includes representative examples of the relationships between financial and physical prices. Many of the listed cases were expected, such as the correlation between Unrefined silver and Silver (CME), or Crude oil and Brent (ICE). At the top of the table is the correlation between Copper wires and Copper (CME), illustrating the many relationships between financial copper prices and copper cathodes or related manufactured goods.
Some cases are particularly noteworthy:
- The correlation between Nickel sulphates and Nickel, which suggests a potential effect of the metal’s financial price on a derived chemical compound;
- The correlation between Zinc ores and Zinc prices on the LME, indicating an upstream impact of financial pricing on the production chain.
As already noted, a high correlation can also stem from random relationships with no real economic link. The table below shows pairs of physical and financial prices that share high correlation values but lack logical production or commercial connections.
Examples of Correlations Without Economic Link
| Physical Price | Financial Price | Correlation (ρ) |
|---|---|---|
| Tropical wood plywood | Raw sugar 16 (ICE), price/Pound | 0.9278 |
| Fresh raw bovine hides | Hot rolled coils North Europe (CME) | 0.9152 |
| Potassium sulphate | Rough rice (CME), price/Short Hundredweight | 0.9041 |
| Sulfuric acid | Soybean oil (CME), price/Pound | 0.9008 |
The analysis shows that these random correlations tend to exhibit slightly lower average values than those selected for the main analysis, generally hovering just above 0.90.
Conclusion
The analysis of correlations between financial and physical prices provides a simple way to estimate how financial price volatility transmits to physical price volatility. Specifically, this impact can be quantified by multiplying the observed correlation by the volatility of the corresponding financial price.
However, as previously emphasized, these numerical results must always be interpreted in light of qualitative evaluation. Knowledge of production chains, sector dynamics, and underlying economic relationships is essential to distinguish actual relationships from spurious or random ones.
Ultimately, only an integrated approach—combining quantitative analysis with strong economic and commodity expertise—can yield truly reliable insights for risk management and procurement decision-making.
Vuoi restare aggiornato sull’andamento dei mercati delle commodity?
Iscriviti gratuitamente alla newsletter PricePedia!
You may be interested in:
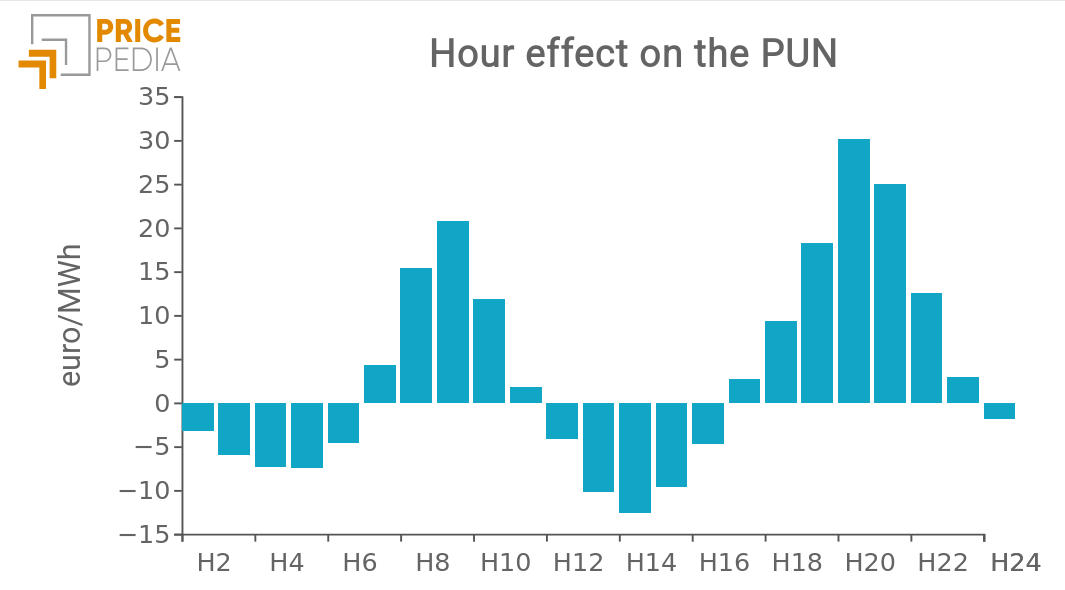
Hourly PUN price: is there a specific “hour” effect?
Published by Emanuele Morelli. .
Electricity's National Single Price Electric Power economic analysis Machine learning and EconometricsAn econometric analysis reveals the existence of a temporal pattern in electricity prices. [ Read all ]
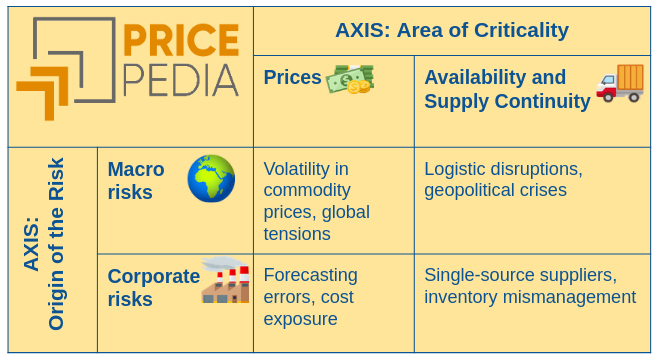
Macro commodity risks and corporate procurement risks
Published by Cristina Luca. .
Procurement economic analysis Procurement Risk ManagementHow procurement management is evolving in an uncertain world [ Read all ]

The macroeconomic approach to commodity market analysis: the link with the global economy
Published by Pasquale Marzano. .
Food economic analysis Analysis tools and methodologiesDemand drivers and price cycles [ Read all ]