Monthly commodity prices update for June 2025
Stability of industrial commodity prices in the face of stagnant European demand
Published by Luca Sazzini. .
EU Customs Global Economic Trends
The update of the monthly PricePedia commodity prices for June 2025 has been published. Overall, commodity prices in euros recorded an increase of three percentage points, interrupting the downward price trend that had started in February. In dollars, however, the price growth was even stronger, at 5%, thanks to the depreciation of the US dollar in June. The main driver of the June price increase was, naturally, the effect of the 12-day war on the average prices of energy commodities.
The following chart shows the price trends, in euros, of raw materials for the European market across the main PricePedia aggregates: Total Commodity[1], Industrials[2], Energy, and Food, all indexed to 100 at their respective January 2022 levels.
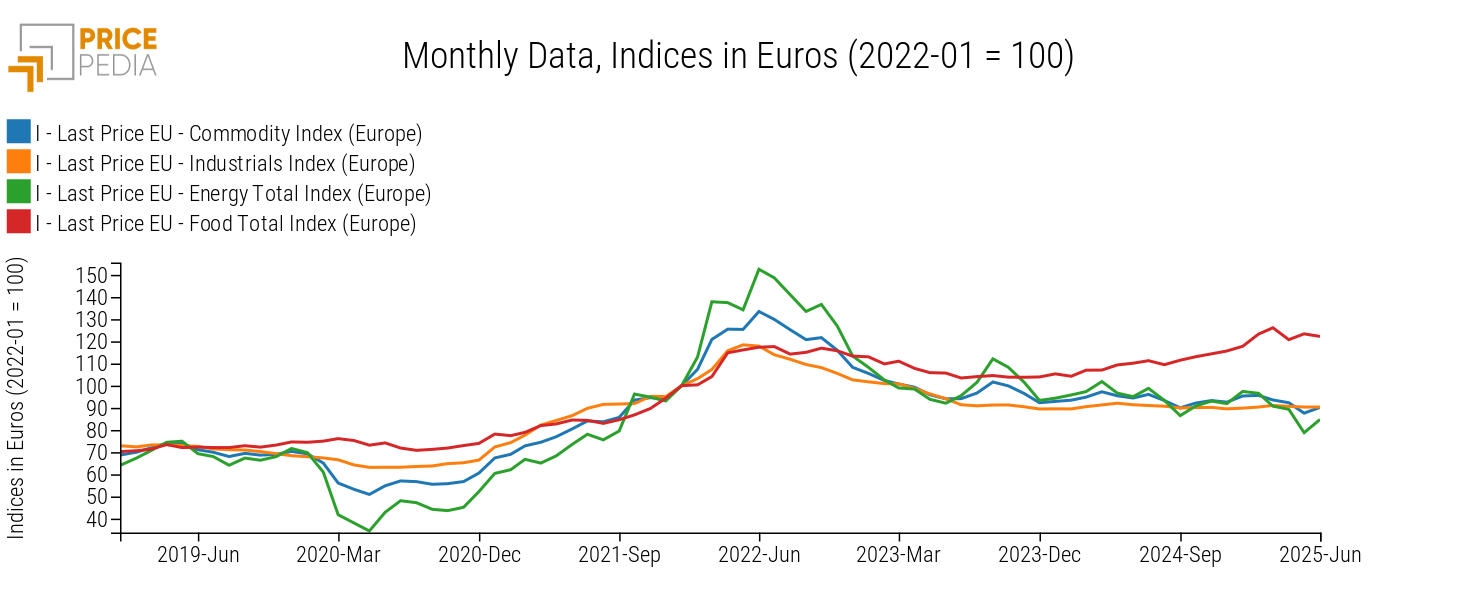
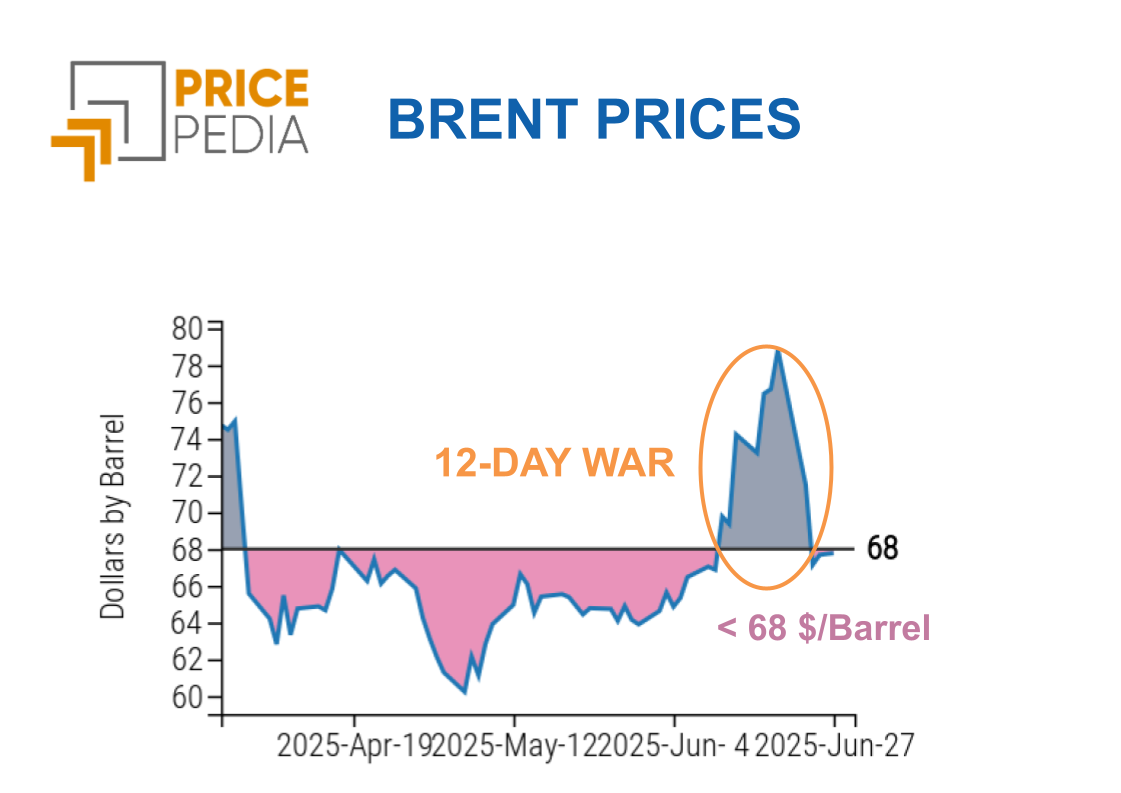
As already mentioned, in June, energy commodity prices rose on average by 7.6%, driven by the escalation of the war in the Middle East, which pushed Brent crude oil financial prices to reach 80 $/barrel in intraday trading. As documented in the article: "Commodity prices: June anomaly overcome", this anomalous growth ended last week when, following the de-escalation in the Middle East, oil prices fell back to around 68 $/barrel.
The following chart shows the unusual trend of Brent prices, caused by the 12-day war between Israel and Iran.
As for industrial commodities, overall, prices remained perfectly stable, with a month-on-month change in euros of 0%.
Food commodities, on the other hand, experienced a slight price decrease, falling by -0.95% in euros compared to May.
Do you want to stay up-to-date on commodity market trends?
Sign up for PricePedia newsletter: it's free!
Industrial commodity prices by category
The flat trend of industrial commodity prices is evident not only at the aggregate level but also across individual product categories, with relatively small monthly variations.
Below are the monthly percentage changes in euro prices for the categories that make up the PricePedia Industrials index.
Chart 3: June 2025, % changes in euros compared to May 2025
Source: PricePedia
In June, Organic Chemicals prices increased by over three percentage points. This growth is mainly due to the rise in hydrocarbon prices, which, being influenced by oil price dynamics, were themselves affected by the 12-day war in the Middle East.
In particular, significant price increases were observed for fluorocarbons, toluene, coal tar xylenes, and benzene.
Except for Organic Chemicals, all other categories included in the PricePedia Industrials index showed monthly price changes, in absolute terms, of less than 2%. This price stability for industrial commodities is linked to the current phase of stagnation in European demand.
A reasonable analytical hypothesis is that, during this phase of high uncertainty affecting European industry, many companies tend to stick with previously made decisions, avoiding significant changes. This behavior makes the dynamics of European commodity markets more predictable, both on the supply and demand sides, thus contributing to price stability. However, it is expected that in the face of a possible trade war with the United States, European companies will be forced to revise their strategies to face new, unexplored scenarios.
Comparison with Chinese market prices
Since the European commodity market is heavily influenced by Chinese price dynamics, it may be useful to compare the European Industrials index with its Chinese counterpart.
Comparison of European and Chinese Industrials Indices

From 2015 to 2022, the dynamics of the two industrial indices were almost identical, but in recent months Chinese customs prices have seen much sharper declines. In particular, since January 2025, following the new trade war launched by President Trump, Chinese prices have fallen by -10%, while European prices have slightly increased by 0.6%. The Chinese price trend reflects the excess supply in this regional market, linked to the persistent weakness of domestic demand caused by the real estate crisis.
It remains to be seen whether, in the coming months, the two indices will return to converge or continue to follow divergent paths.
1. The PricePedia Total Commodity index is calculated as the aggregate of the indices for industrial, food, and energy commodities.
2. The PricePedia Industrials price index is calculated as the aggregate of the following product categories: Ferrous, Non-Ferrous, Wood and Paper, Pharmaceutical Chemicals, Specialty Chemicals, Organic Chemicals, Inorganic Chemicals, Plastics and Elastomers, and Textile Fibers.
