The Importance of Comparisons in Times of High Uncertainty: the Case of Urea
The current high level of uncertainty makes it more difficult to interpret the situation across different markets
Published by Luigi Bidoia. .
Fertilizers Global Economic TrendsCommodity markets are currently being influenced by two major opposing forces. On the one hand, rising costs linked to the energy shock are exerting upward pressure on prices, including industrial commodities. On the other hand, weak global demand is pushing companies to compete more aggressively on prices, limiting increases and, in some cases, leading to substantial price stability.
Expectations for non-energy commodity price increases
On April 29, the European Commission published the results of the Business and Consumer Survey for April 2026. The survey includes a particularly useful question for understanding developments in European commodity markets. EU companies participating in the survey are asked: “How do you expect your selling prices to change over the next 3 months?”. The possible answers are three: increase, remain unchanged, decrease.
Based on the responses collected, an index is calculated as the difference between the percentage of companies expecting price increases and the percentage expecting price reductions. The chart below shows the indices for the chemical, metals, rubber, and plastics sectors.
Expectations of rising selling prices in commodity-producing sectors

The signals emerging from the chart are particularly clear. European base metals producers began predominantly expecting increases in selling prices as early as the second half of 2025. These increases were effectively observed both in the non-ferrous metals sector, driven by rising international prices, and in the ferrous metals sector, supported by the protectionist policies implemented by the European Commission.
However, the most interesting signal provided by the chart concerns the chemical and rubber and plastics sectors. Following the attack by the United States and Israel on Iran, and the resulting increase in energy prices, the percentage of companies expecting price increases for their products rose sharply.
In light of these observations, everything suggests that producers of chemical commodities, elastomers, and plastics are proposing significant price increases to their customers, in some cases even very substantial ones.
In this situation, the key issue concerns the extent to which these increases are actually justified by rising costs and by the demand and supply conditions prevailing in individual markets. These conditions are themselves particularly unstable because they are also influenced by expectations of future price increases. As these expectations strengthen and spread from producers to downstream users, supply tends to contract in order to support expected or desired price increases, while demand tends to rise because buyers try to anticipate future cost increases. In this context, price increases may occur even in the absence of fully rational foundations, simply because of the effects that such expectations generate on the balance between supply and demand.
For a procurement department, the only way to avoid entering a potentially very costly situation is to bring objective information to the negotiation table, capable of anchoring agreed price increases to data that are as verifiable as possible. In this context, all information relating to expectations — such as the data collected through the Business and Consumer Survey mentioned above — is certainly useful for understanding the market environment, but it must be integrated with information capable of measuring the actual price increases currently emerging in the markets.
Several sources can be useful for this purpose:
- forecast results generated through structural models, capable of estimating future price changes under the assumption that the relationships that historically linked changes in costs, demand, and supply to changes in selling prices will remain unchanged;
- customs prices, calculated as averages based on millions of transactions. In this respect, Chinese customs prices are particularly useful because they become available very quickly, approximately 20 days after the end of the month;
- financial prices, especially for longer-term future maturities, which tend to be driven more by structural fundamentals than by short-term speculative dynamics.
The Case of Urea
Using these three sources, we can now analyze the potential impact on urea prices of the energy shock resulting from the attack on Iran by the United States and Israel and the subsequent closure of the Strait of Hormuz.
Urea is a particularly important product because of its role both in the fertilizer market and in the chemical intermediates sector. The urea production process consists of transforming ammonia, which is itself produced using natural gas. As a result, changes in natural gas prices tend to be rapidly transmitted to ammonia and urea prices, as occurred during the 2021-2022 period, when ammonia and urea prices more than doubled.
The global and European urea markets also present two additional characteristics that make them particularly interesting in the current phase:
- more than 30% of internationally traded urea must pass through the Strait of Hormuz[1], making this commodity one of the most vulnerable to a possible closure of the strait;
- even in 2025, Russia remained the second-largest supplier of urea imports to the EU after Egypt[2], making the European market particularly vulnerable to the tensions affecting EU-Russia relations following Russia’s invasion of Ukraine.
The table below reports urea prices in January 2026 and at the latest subsequently available date for four different sources.
Urea prices: a comparison of different sources
| 2026-01 | 2026-03 | 2026-05 | 2026-09 | |
|---|---|---|---|---|
| Price levels: euro per tonne | ||||
| China FOB exports | 339 | 342 | ||
| China financial prices (ZCE): 9-month futures | 216 | 235 | 243 | |
| Intra-EU customs prices: PricePedia forecast | 379 | 479 | 468 | 447 |
| Milan Chamber of Commerce (technical urea) | 703 | 733 | 978 | |
| Percentage changes compared with January 2026 | ||||
| China FOB exports | 0.9 | |||
| China financial prices (ZCE): 9-month futures | 8.8 | 12.5 | ||
| Intra-EU customs prices: PricePedia forecast | 26.4 | 23.5 | 17.9 | |
| Milan Chamber of Commerce (technical urea) | 4.3 | 39.1 | ||
Do you want to stay up-to-date on commodity market trends?
Sign up for PricePedia newsletter: it's free!
The data collected by the Milan Chamber of Commerce require some clarification. They refer to technical urea, a product mainly intended for industrial applications and characterized by higher quality standards and purity levels than fertilizer-grade urea. For this reason, prices are generally higher. In addition, the Milan Chamber of Commerce surveys are conducted during the first days of each month. Consequently, the March data incorporate only the initial phase of the energy price increases, while the May data reflect the market conditions observed during April to a greater extent.
From the analysis of the data and, above all, from their comparison, several particularly relevant findings emerge:
- urea prices in China reacted only marginally to the increase in energy prices. This applies both to Chinese FOB export prices recorded in March and, especially, to financial prices quoted on the Zhengzhou Commodity Exchange (ZCE). During the first week of May, the 9-month futures price was only slightly more than 10% above January levels;
- urea prices in Europe, by contrast, recorded a much stronger reaction, with increases ranging from the 24% projected by the PricePedia structural model to the 39% reported by the Industrial Chemical Products Price Commission meeting on May 5. The 24% increase estimated by the PricePedia model is consistent with the historical elasticity of urea prices relative to the changes recorded in May for ammonia and natural gas prices, which increased respectively by 24% and 32% compared with January 2026 levels. The larger increase in distribution prices recorded by the Milan Chamber of Commerce may depend both on the different type of urea considered and on the greater responsiveness of distributors to precautionary stock-building demand.
Conclusions
The experience of the 2021-2022 period, the use of natural gas as the main feedstock in the production process, the large share of global trade passing through the Strait of Hormuz, and the EU’s dependence on Russian imports make urea one of the most critical commodities in the current phase of heightened tension in the Persian Gulf and the closure of the Strait of Hormuz.
The high level of uncertainty generated by all these factors in the global and European urea markets makes it necessary to compare multiple price sources in order to understand the actual market dynamics and rely on more robust references during procurement negotiations.
The data presented in this article highlight very limited price increases in the Asian market and relatively moderate increases in the European market, in a scenario that is completely different from what occurred during the 2021-2022 period.
PricePedia forecasts suggest that April and May could represent the peak in prices, followed by a possible downward phase already in the coming months, supported by an initial easing of the conflict between the United States, Israel, and Iran and by the reopening of the Strait of Hormuz.
[1] See the article Supply Risk in the Event of a Closure of the Strait of Hormuz
[2] See the article EU: the New Dependency on Russia Is Urea
You may be interested in:

How fertilizer prices affect cereal prices
Published by Pasquale Marzano. .
Wheat Fertilizers Price DriversFertilizers are the channel through which the energy shock is transmitted to wheat prices [ Read all ]

Sulfur prices: a new global uptrend cycle?
Published by Luigi Bidoia. .
Fertilizers Sulphuric acid industry Price DriversAfter the peaks of 2008 and 2022, international quotations exceed €250/ton, signaling the start of an intense phase driven by rigid supply and volatile demand [ Read all ]
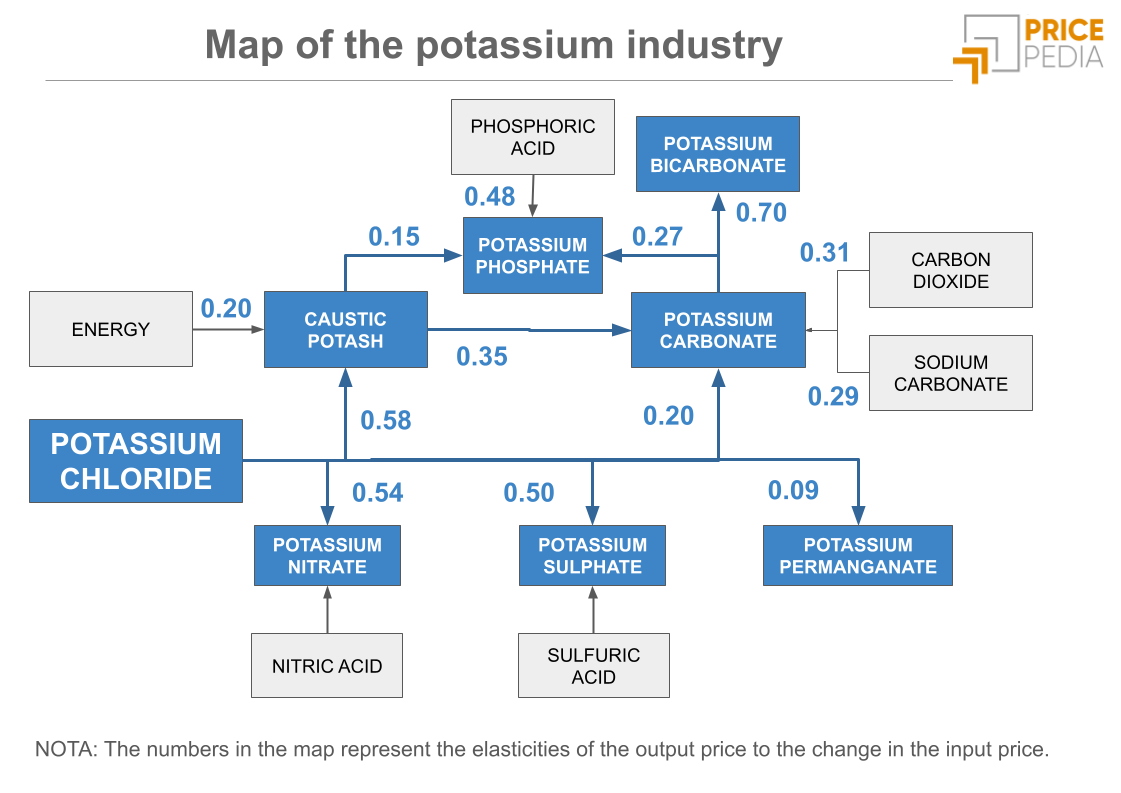
The Potassium Industry: A Dual Supply Chain Between Fertilizers and Advanced Chemistry
Published by Luigi Bidoia. .
Fertilizers Cost pass-throughUn'analisi dell’intensità del cost pass-through per la filiera chimica del potassio [ Read all ]