How fertilizer prices affect cereal prices
Fertilizers are the channel through which the energy shock is transmitted to wheat prices
Published by Pasquale Marzano. .
Wheat Fertilizers Price DriversIn March 2026, the first effects of the energy shock on industrial commodity prices became visible, following the military operations launched on 28 February 2026 by the United States and Israel in Iran. The conflict remains far from resolved and is generating high volatility in the prices of energy inputs such as oil and natural gas.
As illustrated in the March 2026 update, the sectors most exposed are those more directly linked to the petrochemical and natural gas value chain. Among them, nitrogen fertilizers represent a particularly emblematic case. Their prices are closely tied to natural gas through ammonia[1], the main production input: in March 2026, European market prices recorded the strongest month-on-month increases, on average above +14% compared with the previous month.
The chart below shows European customs prices for the main nitrogen fertilizers (urea, ammonium sulfate and ammonium nitrate), expressed in euros per tonne.

Within the price dynamics of the past two years, the March 2026 increase in urea, ammonium nitrate and ammonium sulfate quotations is significant, as it has pushed levels to their highest point in the last two years. However, it is worth noting that these levels remain well below the historical peaks recorded during the 2021–2022 cycle.
How fertilizers influence cereal prices
Fertilizers are a key production input for cereal cultivation, helping increase yields and ensuring the supply of nutrients required for crop growth. For this reason, higher fertilizer prices are expected to be transmitted downstream to the prices of many food products—cereals first and foremost—through the production cost channel.
In general, however, the period between sowing and harvesting cereals can extend beyond six months, making a delayed transmission from fertilizers to cereals a reasonable expectation.
In the case of wheat, however, the relationship appears to be much closer in time.
The chart below compares the price of wheat with the PricePedia fertilizers index.
")
As shown in the chart, the two price series display very similar dynamics. The correlation is also very high, at 0.91. Moreover, the correlation remains equally strong when fertilizers are lagged by one month, while it weakens for longer lags, contrary to what would be expected based purely on the “production” relationship.
The role of financial markets
This result may relate to the fact that the monthly wheat price, linked to production concentrated in a specific period of the year, reflects not only the physical costs actually incurred in production but also commercial and financial factors. In this sense, the one-month lag may reflect not so much technical production timing as the time required for markets to incorporate and interpret new information about production input costs.
An estimate of the relationship between fertilizers and wheat
The relationship between wheat and fertilizers can be estimated using the Engle and Granger dynamic specification model, with two equations (one for the short term and one for the long term).
In the model, the customs price of wheat is the dependent variable, while the fertilizer price lagged by one period is used as a determinant. Among the regressors, the financial price of Soft Red Winter (SRW) wheat quoted on the Chicago Mercantile Exchange (CME) is also included.
All variables are expressed in natural logarithms, allowing the long-term coefficients to be interpreted directly as elasticities: a 10% increase in fertilizer prices and in the CME SRW wheat price leads, in the long run, to a percentage change in the physical price of wheat sold in the EU of 2.4% and 5.7%, respectively. [2].
From a statistical perspective, the estimation results are very strong, with all parameters statistically significant.
One way to assess the model's goodness of fit is to compare the actual wheat price with the regression's long-term fit.
The chart below presents this comparison, with both prices expressed in euros per tonne.

The two series show very similar levels and dynamics, confirming the link between the physical wheat price, the CME financial price and fertilizer prices.
Conclusions
The analysis shows that rising fertilizer prices, driven by the energy shock, are rapidly being transmitted to wheat prices, amplified by the financial component of the market. In this context, monitoring upstream production input prices—alongside the prices of directly purchased materials—can help anticipate price tensions along the entire value chain.
Do you want to stay up-to-date on commodity market trends?
Sign up for PricePedia newsletter: it's free!
1. The relationship between ammonia and fertilizers was analysed in the article The ammonia industry and its derivatives.
2. The long-term estimation results are reported below
| Number of observations: | 171 | |||
|---|---|---|---|---|
| Estimation method: | Engle e Granger | |||
| Transformed: | Logarithmic | |||
| Dependent variable: | Last Price EU - Wheat and meslin (ALFRGR1_LIV_EUR) | |||
| Exogenous variables: | Last Price EU - Fertilizers Index (Europe) - INDICE_AGG_ICFE_LIV_EUR_LAGP1 1-Month delivery - Chicago SRW Wheat (CME) - ALFRFTFT_LIV_EUR_LAGP1 | |||
| Variables | Coefficients | P-value | [0.025 | 0.975] |
| Intercept | 1.430 | 0.000 | 1.180 | 1.679 |
| doganalieu_INDICE_AGG_ICFE_lastprice_LIV_EUR_LAGP1 | 0.238 | 0.000 | 0.184 | 0.293 |
| dailydata_ALFRFTFT_1m_LIV_EUR_LAGP1 | 0.567 | 0.000 | 0.490 | 0.644 |
| Model goodness measures | ||||
| R^2 | 0.909 | R^2-adjusted | 0.908 | |
| Durbin-Watson | 0.575 | Curtosi | 0.416 | |
| The series considered are cointegrated | ||||
You may be interested in:
Sulfur prices: a new global uptrend cycle?
Published by Luigi Bidoia. .
Fertilizers Sulphuric acid industry Price DriversAfter the peaks of 2008 and 2022, international quotations exceed €250/ton, signaling the start of an intense phase driven by rigid supply and volatile demand [ Read all ]
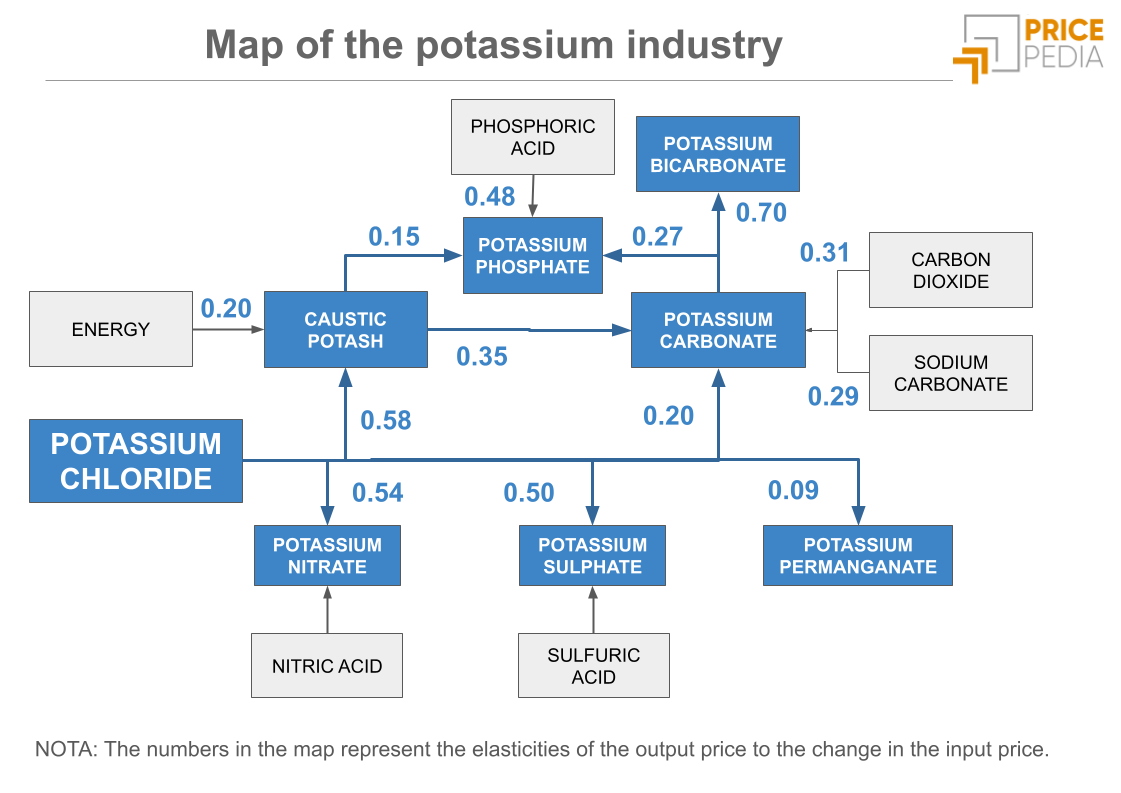
The Potassium Industry: A Dual Supply Chain Between Fertilizers and Advanced Chemistry
Published by Luigi Bidoia. .
Fertilizers Cost pass-throughUn'analisi dell’intensità del cost pass-through per la filiera chimica del potassio [ Read all ]
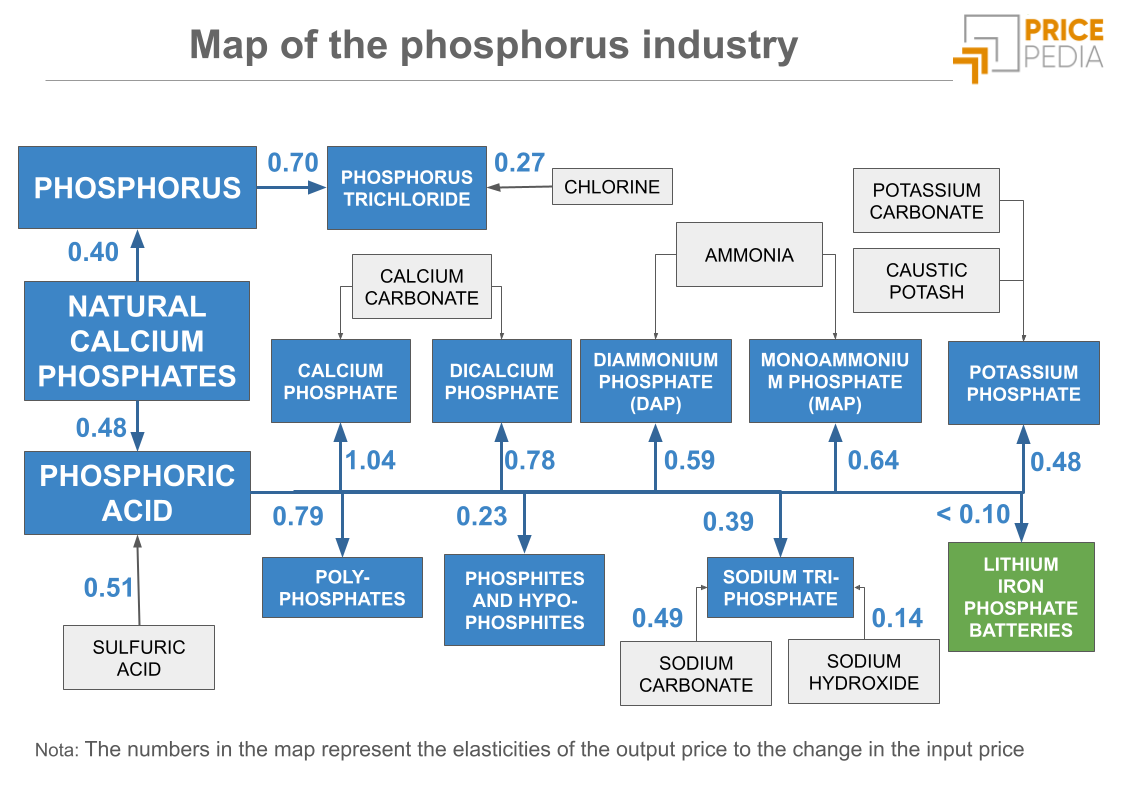
The Phosphorus Industry: Beyond Fertilizers
Published by Luigi Bidoia. .
Fertilizers Phosphorus Cost pass-throughUn'analisi dell’intensità del cost pass-through per la filiera chimica del fosforo [ Read all ]