Relations between financial and physical prices: an analysis through aggregate price indices
Published by Luigi Bidoia. .
Strumenti Analysis tools and methodologies
A recurring topic of economic analysis concerns the importance of financial markets
in influencing the physical prices of commodities.
In some cases, the financial price
(determined on an official exchange by the buy and sell orders of accredited operators)
perfectly coincides with the physical price,
recorded in transactions among non-financial operators.
The two most notable examples are oil and copper[1].
In these cases, it is the financial market that takes on the role of price discovery,
that is, determining the price capable of balancing supply and demand,
considering both current market conditions and future expectations.
The physical price, unique at the global level, simply replicates the financial price.
However, in many other cases the influence of the financial price on the physical price is weaker. The main reason lies in the absence of a single global price. When physical prices differ significantly across world regions, it is reasonable to expect that a single financial price cannot replicate them, unless financial markets themselves are also organized regionally. An example is provided by hot rolled coils (HRC), whose prices vary considerably in both physical and financial markets across the three main world economic areas.
In such contexts, it becomes useful to measure the intensity of the relationship between financial and physical prices. There is a substantial difference between cases where this relationship approaches 1, with physical prices almost entirely determined by financial prices, and cases where the relationship is close to zero, with only a limited influence of financial markets.
The analysis can be carried out case by case, at the level of individual commodities. However, an alternative approach is to compare aggregate indices at the level of commodity families. An aggregate index brings together in a single measure the common signals present across multiple prices. Comparing an index of financial prices with an index of physical prices, both referring to the same family, provides an average assessment of how, within that family, financial prices influence physical prices.
In this way, aggregate indices are not merely descriptive tools, but become useful instruments for extracting the common signal that links financial and physical dynamics, offering a comparable mapping across different commodity groups.
PricePedia Aggregate Price Indices
The following table shows the list of commodity families used in PricePedia, together with the corresponding aggregate indices calculated on the basis of both financial and physical prices.

For some families — specifically chemicals, wood and paper, and textile fibers — no aggregate financial indices have been calculated, since the number of available financial prices is too limited to produce a representative index for the entire family.
For the Plastics and elastomers family, however, it has been possible to construct an aggregate financial index mainly using quotations from Chinese exchanges. For this reason, the financial index for this family is labeled (China). Following the same principle, the financial indices for metals (both ferrous and non-ferrous) are labeled (Europe), as they include quotations from European exchanges (such as the London Metal Exchange) as well as financial prices based on values observed in European markets.
Finally, precious metals are not included in the Total Commodity index, since the market mechanisms that determine their prices differ substantially from those that govern industrial commodities.
Relationship between financial and physical prices
To quantify the relationship between financial and physical prices,
we estimated a regression of the physical price in euros
as a function of the financial price (also expressed in euros)
and the Dollar/Euro exchange rate.
This allows us to measure the effect on physical prices
arising both from financial prices and from exchange rate fluctuations.
The dynamic model adopted is the Engle & Granger framework,
with two equations: one describing the long-run relationship
and the other the short-run adjustment.
All variables were transformed into logarithms,
so that the estimated coefficients can be interpreted as elasticities.
The following table reports the statistically significant coefficients.
Results – Distribution of logistic risk by product family
| Commodity families | Long-run coefficients | Short-run coefficients | ||
|---|---|---|---|---|
| Financial prices | $/Euro exchange rate | Impact | Adjustment | |
| Energy | 0.84 | -0.44 | 0.80 | -0.34 |
| Food | 0.45 | -0.10 | 0.54 | -0.07 |
| Non-ferrous metals | 0.82 | -0.39 | 0.61 | -0.16 |
| Ferrous metals | 0.73 | -0.99 | 0.40 | -0.05 |
| Plastics & elastomers | 0.48 | 0.52 | -0.17 | |
From these results, several findings can be highlighted:
- Relationship between financial and physical prices:
- Energy: the relationship is particularly strong. The long-run elasticity is the highest (0.84), close to 1, and the short-run coefficients (impact and adjustment [2]) are also the largest among all families.
- Food and plastics & elastomers: the relationship is generally weak. This is due to the high degree of regionalization of physical prices and the fact that the reference financial prices mainly reflect quotations from non-European markets (China and North America). It is therefore not surprising that the impact on European physical prices is limited.
- Metals: the results fall in an intermediate position. For non-ferrous metals, the relationship is closer to that of the energy family, while for ferrous metals the effect is weaker.
- Effect of the exchange rate:
- The elasticity of physical prices in euros with respect to the $/Euro exchange rate is always negative, with values between 0 and -1. This means that when the dollar depreciates, physical prices in euros tend to rise less (or fall more) compared to financial prices. Conversely, when the dollar appreciates, physical prices in euros increase more strongly (or decline less) than financial prices.
- The effect is stronger when prices are highly regionalized and the financial index is anchored to the European market. For ferrous metals, elasticity is equal to -1, indicating that changes in the exchange rate are fully transmitted to European physical prices in euros.
- The effect is negligible (or very small in absolute value) when the financial index reflects prices from other regions, as in the case of food or plastics & elastomers.
- For energy and non-ferrous metals, the exchange rate effect is significant, with elasticities around -0.4, showing that these two families share not only a strong financial–physical price relationship but also a common sensitivity to exchange rate variations.
Summary
The relationship between the financial price of a commodity and its corresponding physical market price varies from case to case. A first mapping of these relationships can be obtained using estimates based on aggregate indices. The results allow us to classify the world of commodities into three main groups:
- Energy and non-ferrous metals: the effect of financial prices on physical prices is strong, with long-run elasticities close to 1. In addition, the Dollar/Euro exchange rate influences physical prices in euros with an elasticity of around -0.4.
- Food and plastics & elastomers: in this case, changes in financial prices tend to be reflected less intensively in physical prices, indicating a weaker link between financial and physical markets. For these families, the effect of the Dollar/Euro exchange rate on physical prices in euros is negligible.
- Ferrous metals: the effect of financial prices on physical prices is comparable to that observed for energy and non-ferrous metals. What distinguishes this family is the particularly strong sensitivity to the Dollar/Euro exchange rate, with elasticity close to -1.
This mapping provides an initial representation of the relationship between financial and physical prices, broken down by commodity type. Its practical usefulness lies in offering a preliminary criterion for assessing when movements in commodity financial markets can be expected to translate into equivalent impacts on the corresponding physical markets.
[1] For an analysis of the equality between financial and physical prices in the case of copper, see the article Minerals, metals and semi-finished products: the case of copper.
[2] The impact coefficient of the short-run equation measures the elasticity of the monthly change in the physical price with respect to the monthly change in the theoretical price, obtained from the explanatory variables. The adjustment coefficient measures the variation in the physical price as a correction to the gap observed in the previous month between the actual physical price and the theoretical price. This coefficient is expected to be negative. Indeed, if the actual price is higher than the theoretical one, a decrease in the physical price is expected in order to adjust towards the theoretical price. Conversely, if the actual price is lower than the theoretical one, an upward adjustment of the physical price is expected.
You may be interested in:

The arrival of foundation models in time series forecasting
Published by Riccardo Gentilucci. .
Strumenti Machine learning and EconometricsNew Machine Learning Forecasting Systems [ Read all ]

Tokens & Transformers: the heart of modern Machine Learning models
Published by Luigi Bidoia. .
Strumenti Machine learning and EconometricsCome una tecnologia unificata ha accelerato l’evoluzione dell’AI [ Read all ]
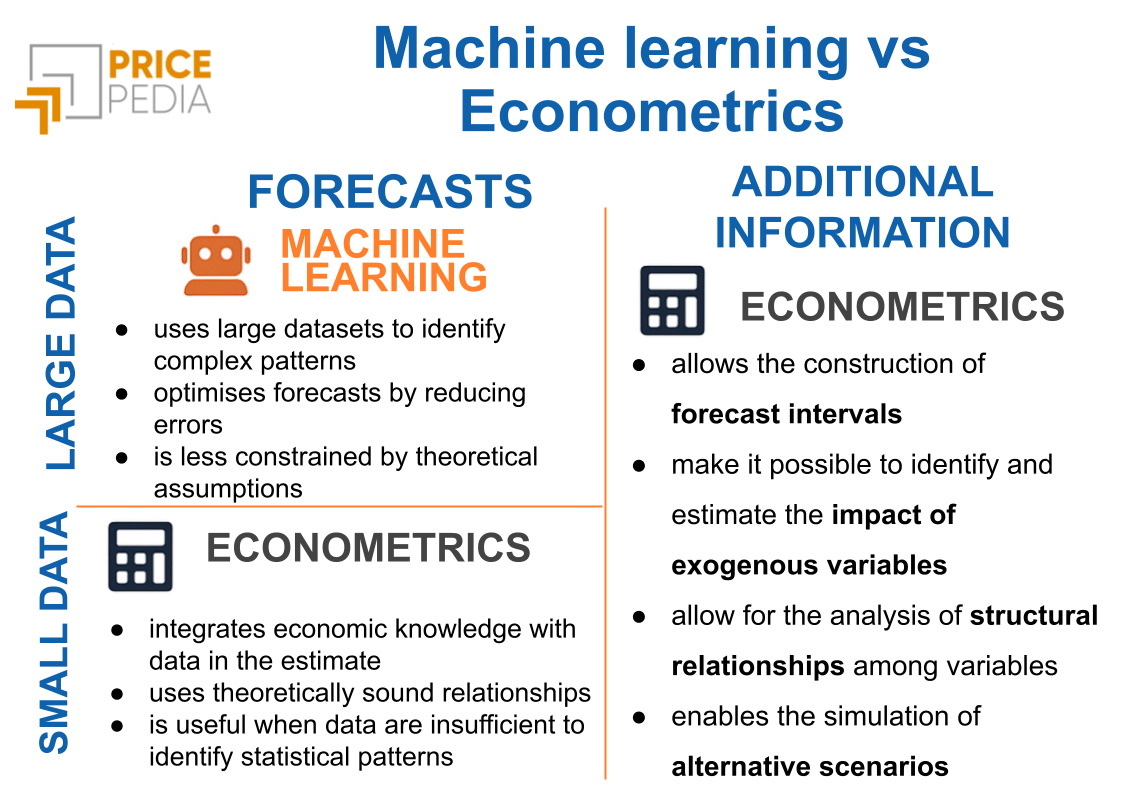
Machine Learning and Econometrics: Alternative or Complementary Tools?
Published by Luigi Bidoia. .
Strumenti Machine learning and EconometricsIl Machine Learning potrà sostituire l’econometria nelle previsioni, ma non nell’analisi e nella comprensione delle cause di un fenomeno [ Read all ]