PricePedia Scenario for April 2026
How the energy shock is shaping procurement material prices over the next two years
Published by Pasquale Marzano. .
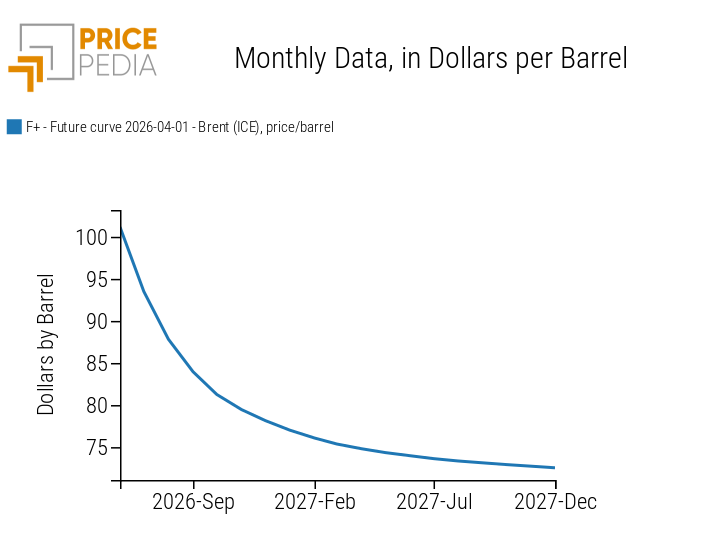
Forecast ForecastThe PricePedia Scenario, developed using information available as of April 1, 2026, is strongly influenced by assumptions about how oil and natural gas prices may evolve in the coming months. The most likely trajectory is the one currently implied by the Brent crude and TTF natural gas futures curves shown in the charts below.
Energy Commodity Futures Curves
Brent Crude Oil, USD per barrel
TTF Natural Gas, Euro/MWh
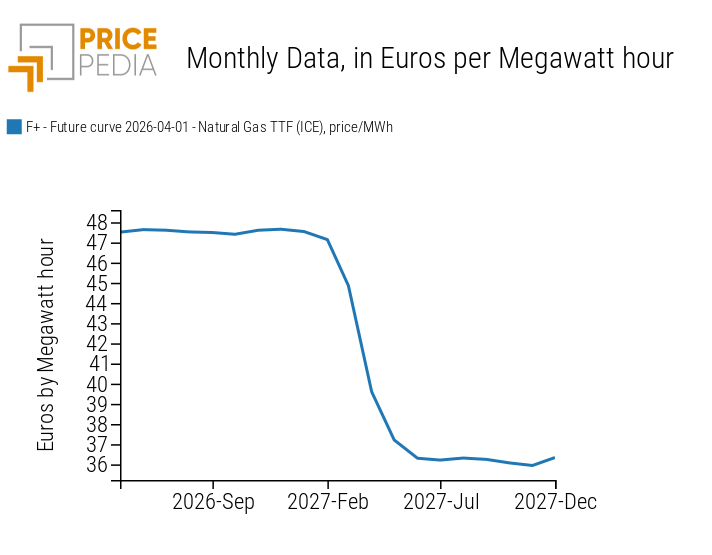
Financial markets currently expect the conflict between the United States–Israel coalition and Iran to potentially ease by the summer, supporting a significant decline in oil prices, which are projected to fall below 85 dollars per barrel by October. By contrast, natural gas prices are not expected to decline significantly during 2026, due to low European inventories and the need to secure supply for storage refilling over the summer months.
The April 2026 PricePedia Scenario
The table below presents annual changes in euro for the main commodity aggregates included in the PricePedia Scenario: Industrials[1], Commodity[2], Energy, and Food.
Table 1: Annual Growth Rates (%) of PricePedia Aggregate Indices, in Euro
| 2024 | 2025 | 2026f | 2027f | |
|---|---|---|---|---|
| I-Forecast Scenario, 1 Apr. 2026-Commodity Index (Europe) | −4.02 | −4.82 | +7.25 | −6.31 |
| I-Forecast Scenario, 1 Apr. 2026-Energy Total Index (Europe) | −6.11 | −11.69 | +19.02 | −12.68 |
| I-Forecast Scenario, 1 Apr. 2026-Industrials Index (Europe) | −4.63 | −3.16 | +4.28 | +3.78 |
| I-Forecast Scenario, 1 Apr. 2026-Food Total Index (Europe) | +9.29 | +17.20 | −15.42 | −6.38 |
Assuming an average oil price of around 90 dollars per barrel in 2026, easing to 75 dollars in 2027, and TTF natural gas averaging 48 euro/MWh in 2026 and 41 euro/MWh in 2027, industrial commodity prices are forecast to increase by +4.3% in 2026 and +3.8% in 2027. Overall, the expected growth across 2026–2027 remains below +10%, significantly lower than the more than +50% surge recorded during 2021–2022.
During the 2021–2022 energy shock, commodity prices were also driven by supply constraints caused by the global shipping crisis, which coincided with a strong post-pandemic rebound in demand.
Within the core industrial raw materials segment, the strongest increases are expected for materials most closely linked to the petrochemical value chain, as highlighted in the March 2026 update article. In particular, nitrogen fertilizers are expected to rise by around +20% on average in 2026. A notable increase—though smaller than for fertilizers—is also projected for hydrocarbons and thermoplastic polymers, both expected to grow by more than +10% over the same period.
For non-ferrous metals, euro-denominated prices are projected to rise strongly in 2026–2027, exceeding +12% overall. This reflects the high sensitivity of these markets to global demand for energy-transition materials, at a time when supply concerns remain. For ferrous metals, prices are expected to increase slightly above +8% over the same period, supported by higher energy costs and European safeguard measures despite a global supply surplus.
Within the Food segment, tropical commodities are expected to continue their downward trend in both 2026 and 2027, while other food commodities are entering a growth phase, with prices projected to increase by +4% in 2026 and close to +10% in 2027.
Conclusions
Based on the oil and gas price path implied by futures curves, the current energy shock is expected to translate into a moderate overall increase in commodity prices, especially when compared with the exceptional surge seen in 2021–2022. Price growth is expected to remain in single-digit territory throughout 2026–2027, with stronger pressure in sectors most exposed to the petrochemical value chain and in metals linked to the energy transition.
However, the scenario remains highly dependent on geopolitical developments, implying a significant degree of uncertainty. Financial market expectations provide an up-to-date and useful benchmark, but they remain fragile: any escalation in the conflict or renewed tension in energy supply could quickly reshape the price outlook and amplify the impact across industrial value chains.
1. The PricePedia Industrials index results from the aggregation of the indices relating to the following product categories: Ferrous, Non-Ferrous, Wood and Paper, Chemicals: Specialty, Organic Chemicals, Inorganic Chemicals, Plastics and Elastomers and Textile Fibres.
2. The PricePedia Commodity index results from the aggregation of the indices relating to industrial, food and energy commodities.
You may be interested in:

PricePedia Scenario for March 2026
Published by Pasquale Marzano. .
Forecast ForecastCommodity Prices: how the 2026-2027 forecast is changing in response to the energy shock [ Read all ]

PricePedia scenario for steel tube prices
Published by Luca Sazzini. .
Ferrous Metals Forecast Steel tubes ForecastWhen will steel tube prices reverse their current downward trend? [ Read all ]

Raw material costs and prices in the furniture industry
Published by Pasquale Marzano. .
Forecast Analysis tools and methodologiesAfter the 2021-2022 surge, raw materials have reduced their impact on the sector. What should procurement expect in 2026-2027? [ Read all ]