What the Numbers Really Say About Gas in Europe
Which charts can help better interpret the European gas market
Published by Luigi Bidoia. .
Natural Gas Analysis tools and methodologiesIntroduction – It’s Not Enough to “Make a Chart”
Data contain information, but that information is not always immediately readable. It is common to see charts showing trends, levels, and changes; yet simply visualizing data in their most direct form does not guarantee that the most relevant insight will truly emerge.
A Data Scientist’s distinctive expertise does not lie merely in “producing charts,” but in designing the representation of data: deciding how to organize them, which transformations to apply, and which structure to adopt so that hidden information becomes visible.
Two examples can help illustrate how decisive the design of data representation can be. Both relate to the European gas market, which is currently characterized by growing uncertainty about the evolution of both supply and demand.
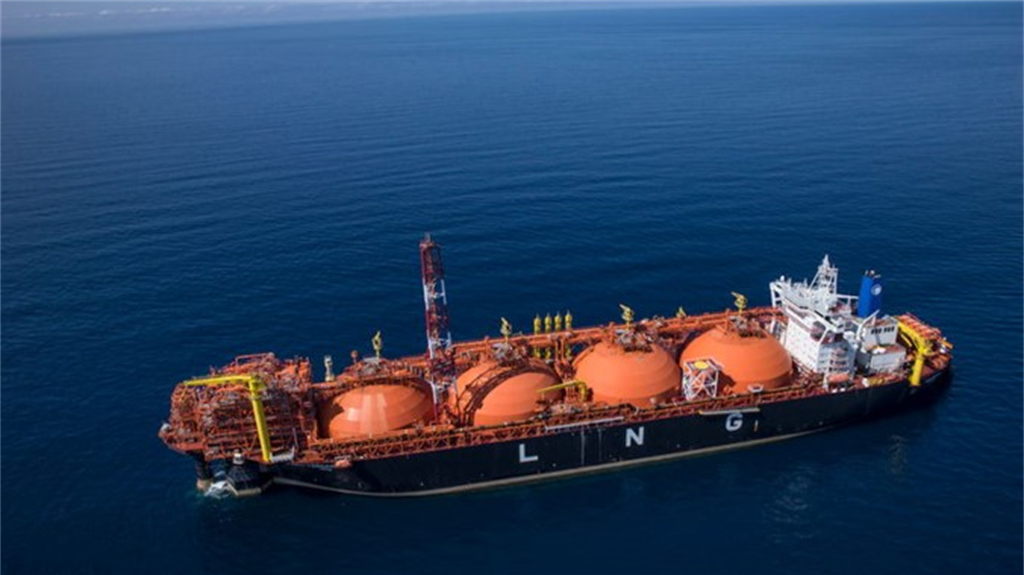
On the supply side, the main sources of uncertainty are changes in the storage cycle between the summer and winter seasons and the ongoing substitution of pipeline gas with Liquefied Natural Gas (LNG).
On the demand side, uncertainty mainly stems from the ongoing substitution process between electricity generation from gas-fired power plants and generation from renewable energy sources.
Do you want to stay up-to-date on commodity market trends?
Sign up for PricePedia newsletter: it's free!
European Union Gas Storage Levels
In recent days, the idea that gas storage levels in Europe have already reached really critical threshold has been widely circulating. A traditional chart showing storage levels over the entire time span seems to confirm this fact. Below is the chart of daily storage levels, expressed in volume, for the total EU countries.
Gas stocks, volumes (Total Europe)
")
The signal emerging from this chart is that current EU storage levels are very low, yet apparently not very different from what was observed in several previous years, including last year, the 2021–2022 biennium, and 2017–2018.
However, this chart can be misleading because the minimum storage levels were reached on different days in different years. Gas storage follows a strong seasonal pattern: it increases during the summer season and decreases during the winter season. Observing the entire historical series without accounting for this element makes it difficult to compare different years correctly. For example, reaching the same storage level in mid-February is not equivalent to reaching it in mid-April.
To eliminate the distortion caused by seasonality, storage levels can be compared by looking at the value reached each year on the same calendar day. This transformation can easily be performed on the PricePedia platform by filtering the data for a specific day of the year – for example, February 19. The result is shown in the following chart.
Gas stocks in the EU on 19 February each year

The insight provided by this second chart is that storage levels on February 19, 2026, are worse than in any other year and comparable only to that recorded on the same date in 2022, when EU gas prices were in the middle of an exceptional price surge.
When assessed on a same-day-of-the-year basis, the 2026 storage situation therefore appears highly concerning. However, storage levels at different points of the year are only one of the many factors that contribute to determining gas prices in Europe.
These factors are carefully considered by market participants who buy and sell gas daily on financial markets and who, through their decisions, implicitly express their expectations about what may happen in the near future. Once again, data must be properly organized and transformed to make the market’s average view clearly visible.
The Forward Curve at the TTF
When analyzing gas futures prices traded on a financial market, the usual approach is to observe the historical series of a single contract or to compare the dynamics over time of multiple contracts with different expiry dates. However, this representation is not necessarily the most informative.
To understand the expectations embedded in market prices, it is more useful to examine the forward curve, namely the configuration of prices for different maturities observed on the same day. In other words, the futures curve is built by aligning contracts according to their time to maturity.
For the EU gas market, this curve can be constructed using futures contracts traded on ICE (Intercontinental Exchange), whose underlying is the day-ahead gas price determined at the Title Transfer Facility (TTF), the main Dutch trading hub.
The TTF forward price structure, shown in the following chart, makes it possible to extract information that does not emerge from simply observing the historical time series.
Term structure of gas futures prices traded on the TTF

An analysis of the current structure does not signal particular concern among financial operators. No abnormal risk premia appear across future maturities that would suggest an imminent and disproportionate risk.
On the contrary, prices expected for summer 2026 are lower than current levels, suggesting that, according to the average expectations of operators active in the TTF market, the higher demand linked to the need for faster storage refilling could be more than offset by lower gas demand from gas-fired power plants.
Market expectations point to even lower prices in spring/summer 2027, when the effects of weaker demand would combine with those of increased liquefied natural gas supply.
Conclusions
The European gas market is currently characterized by a high degree of uncertainty. Since the beginning of the year, gas prices at the Dutch TTF trading hub have shown significant volatility, moving within less than 60 days across a very wide range, between 27 and 40 euro/MWh.
The main source of uncertainty has been the speed at which storage levels have declined over the course of the year. If we consider only the readings recorded on February 19 of each year, 2026 stands out as one of the worst years of the past decade, comparable only to the difficult year 2022.
However, the dynamics of the two years are fundamentally different. In 2022, storage levels were falling because gas was becoming scarce; in 2026, by contrast, storage levels have declined also because distributors expect to be able to purchase gas next spring/summer at lower prices.
This expectation clearly emerges from the TTF forward curve, which shows lower prices for contracts maturing in spring and summer. The shift in EU gas supply from pipelines to LNG regasification terminals has changed distributors’ procurement strategies, despite an EU regulation enacted in 2022 requiring all Member States to fill storage facilities to at least 90% by November 1 each year.
The lower prices of futures contracts maturing in spring and summer 2026, and even lower prices for those maturing in 2027, indicate that industry operators consider the current relatively low storage levels to be manageable.
You may be interested in:
The direct effects of Natural Gas on procurement materials
Published by Pasquale Marzano. .
Strumenti Natural Gas Analysis tools and methodologiesWhich products are most exposed to recent fluctuations in energy inputs? [ Read all ]
Global Gas Market: Towards New Equilibria
Published by Luigi Bidoia. .
Natural Gas Price DriversEuropa, Cina e Stati Uniti: l’intreccio tra mercati finanziari e fisici, GNL e gasdotti nella formazione dei prezzi [ Read all ]
Gas Prices in Italy: Rising PSV-TTF Spread
Published by Luigi Bidoia. .
Natural Gas Price DriversRischio Qatar e ritardi nell'accumulo scorte alimentano la speculazione [ Read all ]