PricePedia Scenario for November 2025
Continuation of the decline in purchasing material prices through 2026
Published by Pasquale Marzano. .
Forecast Forecast
The PricePedia Scenario has been updated with information available as of November 5, 2025. On average this year, global industrial production, the main driver of global raw material demand, is expected to close with an increase of over +2% compared to 2024. However, this growth almost entirely reflects the temporary effect associated with front-loading, that is, the anticipation of purchases by companies during the first part of the year.
The negative effects of trade policies are expected to materialize mainly in the coming months, leading to a cumulative slowdown in 2026: on average next year, industrial production is projected to remain roughly unchanged compared to 2025 (+0.2%).
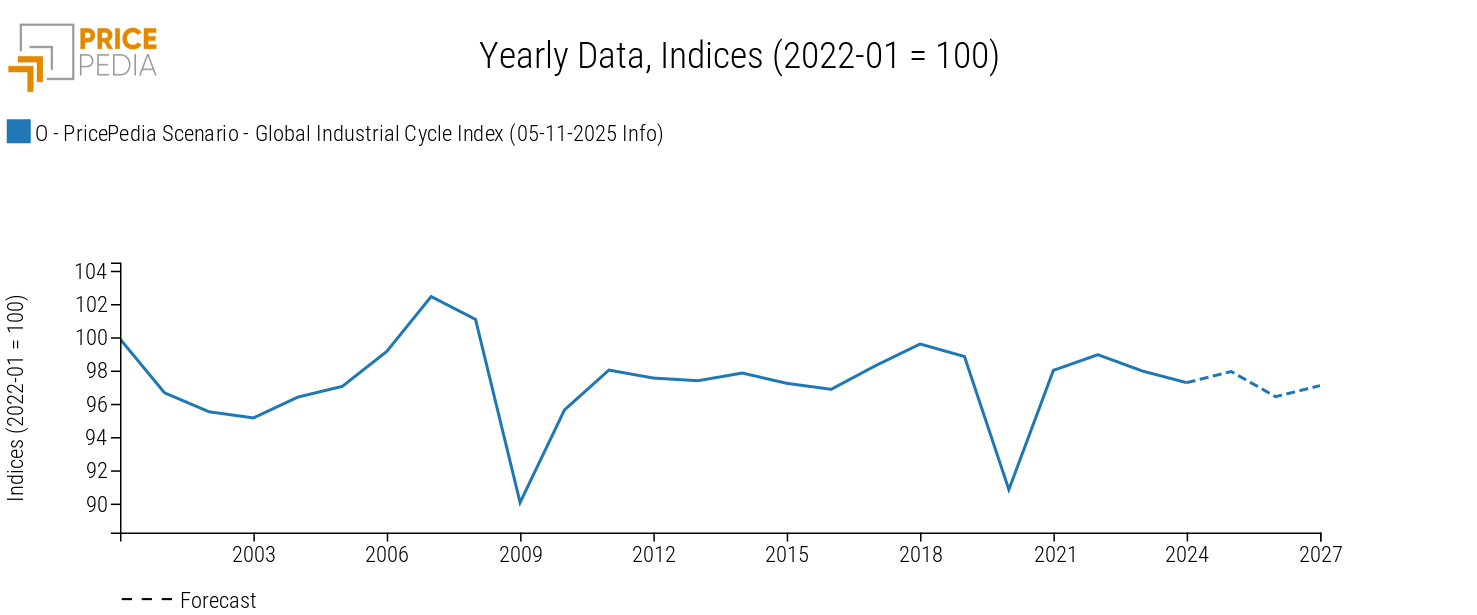
This translates into a pattern of the global industrial cycle[1], developed by PricePedia and shown below, that mirrors the trend in industrial production.
Global Industrial Cycle, November 2025 Scenario

The increase expected in the 2025 average, equal to +0.7%, brings the index back to the average levels of 2023. In 2026, the global industrial cycle is expected to reflect the effects of restrictive trade policies, recording a decline of -1.5% compared to the previous year’s average. A recovery in the cycle is expected to take shape during 2027.
Forecast of Purchasing Material Prices
The dynamics of the global industrial cycle show that demand for raw materials remains in a phase of prolonged weakness, despite the anticipation of purchases in the first part of the year ahead of the implementation of U.S. tariffs. This weakness implies the continuation of the downward trend that has been characterizing raw material prices.
Overall, prices in euros for purchasing materials are expected to close 2025 with an average decrease of -6.2%. In 2026, the annual average decline is expected to settle around -5.7%.
The following table shows the annual changes in euro prices for the main commodity aggregates included in the PricePedia Scenario: Industrial[2], Total Commodity[3], Energy, and Food.
Table 1: Annual Percentage Changes (%) of PricePedia Aggregate Indices, in Euro
| 2024 | 2025f | 2026f | 2027f* | |
|---|---|---|---|---|
| I-PricePedia Scenario-Commodity Index (Europe) (05-11-2025 Info) | −4.52 | −6.16 | −5.73 | −0.86 |
| I-PricePedia Scenario-Energy Total Index (Europe) (05-11-2025 Info) | −5.89 | −12.74 | −12.10 | −2.32 |
| I-PricePedia Scenario-Industrials Index (Europe) (05-11-2025 Info) | −4.52 | −2.69 | −0.55 | +1.34 |
| I-PricePedia Scenario-Food Total Index (Europe) (05-11-2025 Info) | +3.08 | +9.40 | −0.21 | −2.52 |
The sharpest decline is expected for euro-denominated prices of energy commodities, down by more than -12% per year in both 2025 and 2026. In particular, the decision by OPEC+ to halt oil production increases in the first quarter of next year, as reported in the article “Commodity prices fall due to the unexpected rise in inventories”, is not currently perceived by market participants as a significant support to prices, given the expected oversupply in the crude oil market. In this scenario, the Brent price is projected to move around the $65 per barrel mark.
For industrial raw materials as well, the downward trend is expected to continue throughout 2025–2026. This dynamic is driven by several factors, including the weakness of European manufacturing and the downward pressure from the prices of commodities exported by China.
On average this year, prices are expected to fall by -2.7% compared to 2024. During 2026, the decline is projected to lose momentum and settle around -0.6%.
As for food commodities, 2025 is expected to close with an annual average increase of over +9%, driven by exceptional price hikes, already realized, in tropical commodities. On average in 2026, prices are projected to stabilize slightly below 2025 levels (-0.2%). A more pronounced decrease is expected to materialize in 2027, amounting to -2.5% compared to the 2026 average.
1. The global industrial cycle index is constructed by purifying the actual dynamics of industrial production from its trend. Since the supply of commodities tends to vary according to long-term economic growth expectations, while the demand for commodities is more linked to actual cyclical uses, the global industrial cycle index tends to reproduce the conditions of tension between demand and supply on the commodity market: when it increases, it means that the demand for commodities increases more than the supply; vice versa when it decreases.
2. The PricePedia Industrials index results from the aggregation of the indices relating to the following product categories: Ferrous, Non-Ferrous, Wood and Paper, Chemicals: Specialty, Organic Chemicals, Inorganic Chemicals, Plastics and Elastomers and Textile Fibres.
3. The PricePedia Commodity index results from the aggregation of the indices relating to industrial, food and energy commodities.


