The impact of trade tensions on commodity prices
Oil market stabilises, but tensions persist on derivatives prices
Published by Luca Sazzini. .
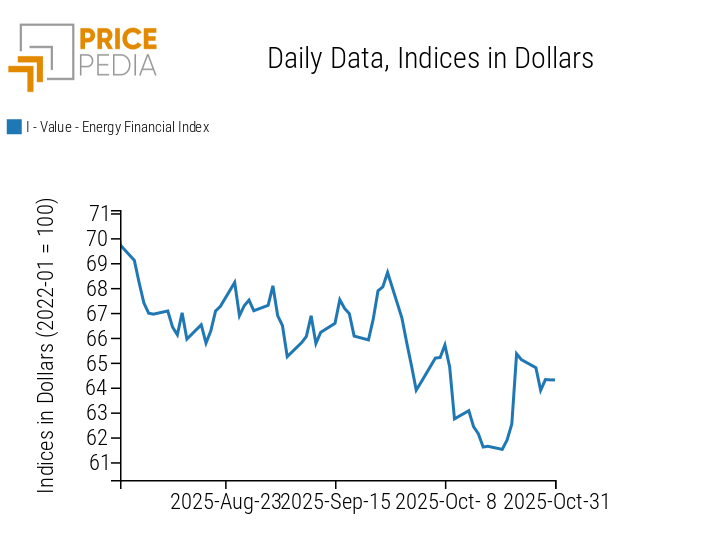
Conjunctural Indicators Commodities Financial WeekAfter last week’s increases, supported by the announcement of new sanctions against Russian oil companies, financial prices of crude oil have halted their growth, stabilizing around $65/barrel. The slowdown was driven by reports suggesting that OPEC+ is ready to approve a new supply increase at its upcoming weekend meeting.
Fears of further production growth pushed oil prices lower at the beginning of the week, followed by a partial recovery after the drop in U.S. inventories.
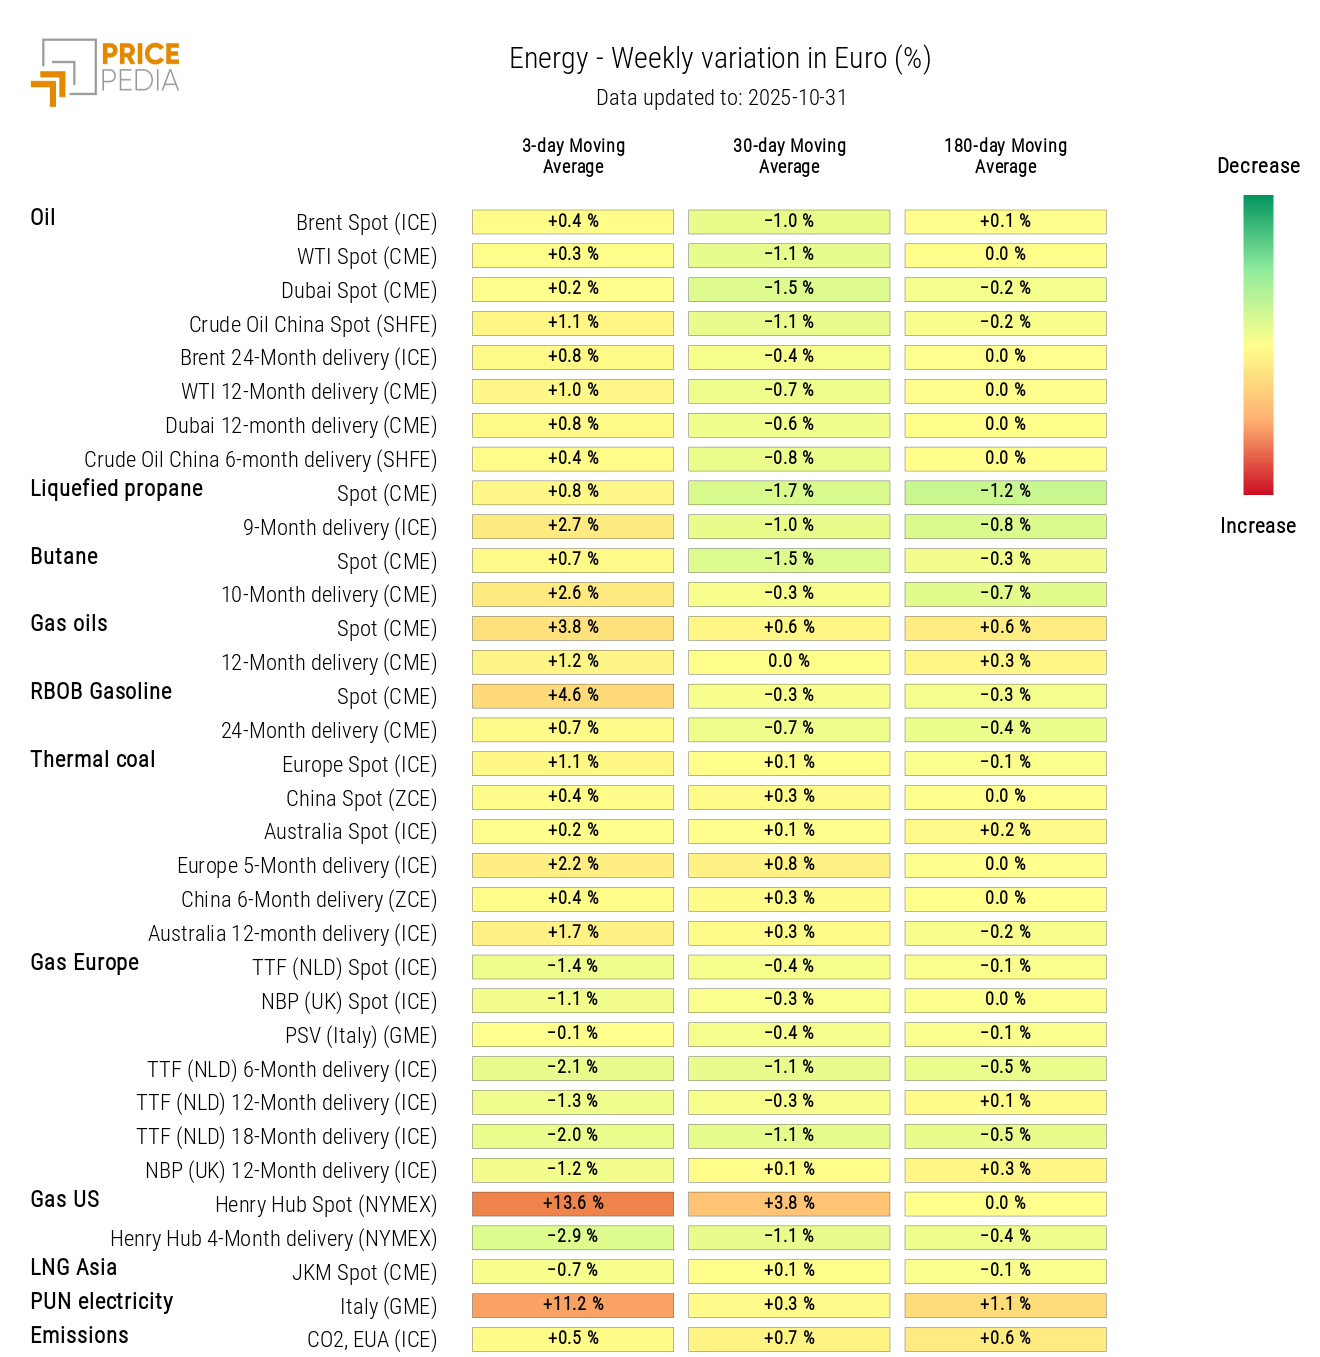
For refined products, however, prices continued to rise, supported by concerns linked to sanctions against Russia. The main worries involve diesel, due both to the potential decline in Russian exports and to the risk that Indian refineries may cut production if they stop purchasing Russian oil.
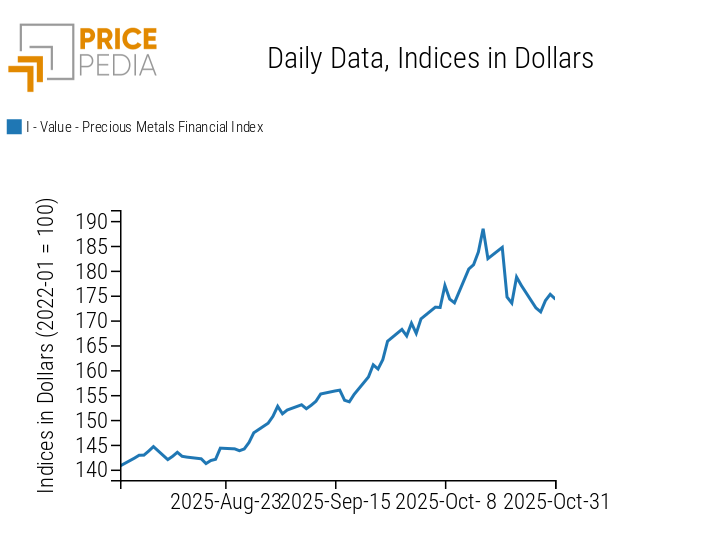
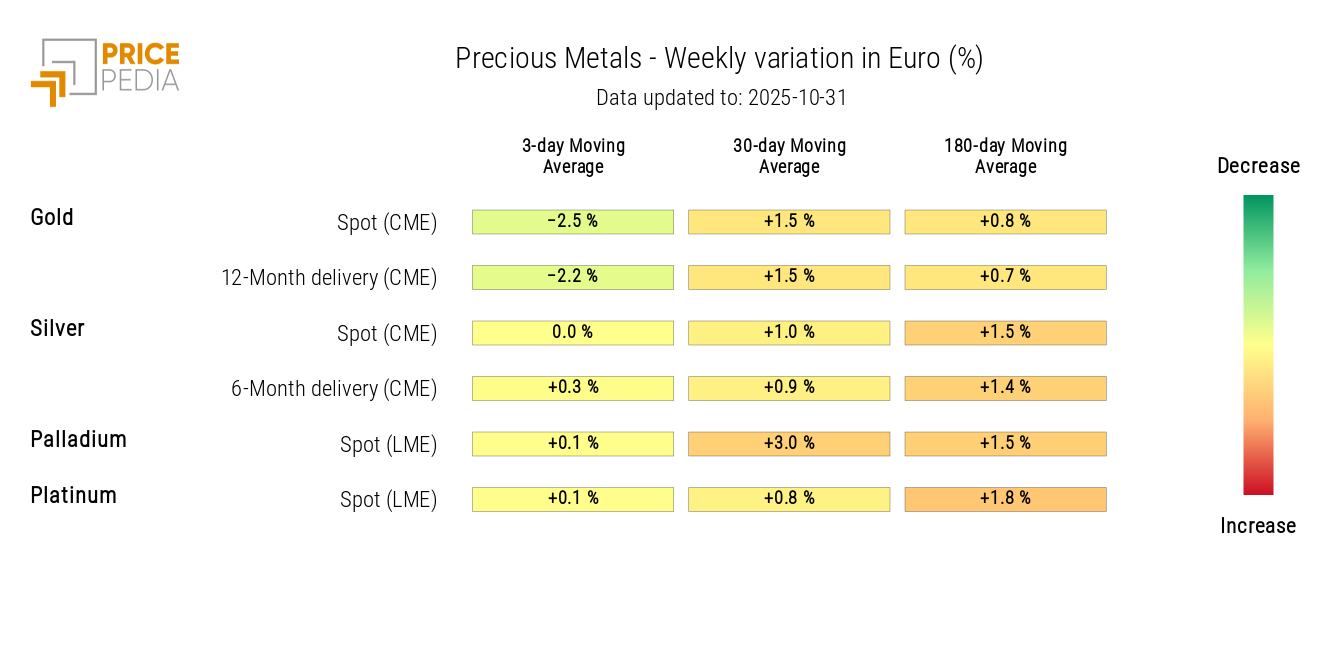
In the precious metals market, the profit-taking trend that began last week intensified, driven by the easing of trade tensions between the United States and China. Prices of gold, silver, palladium, and platinum fell by more than 3% on Monday alone.
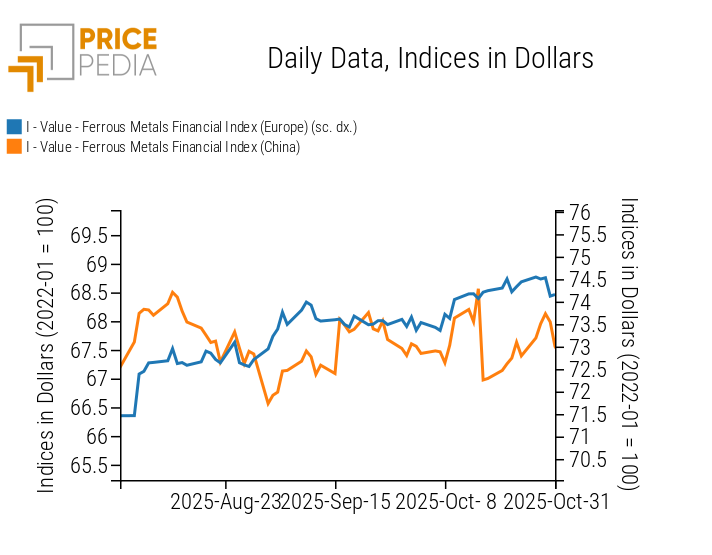
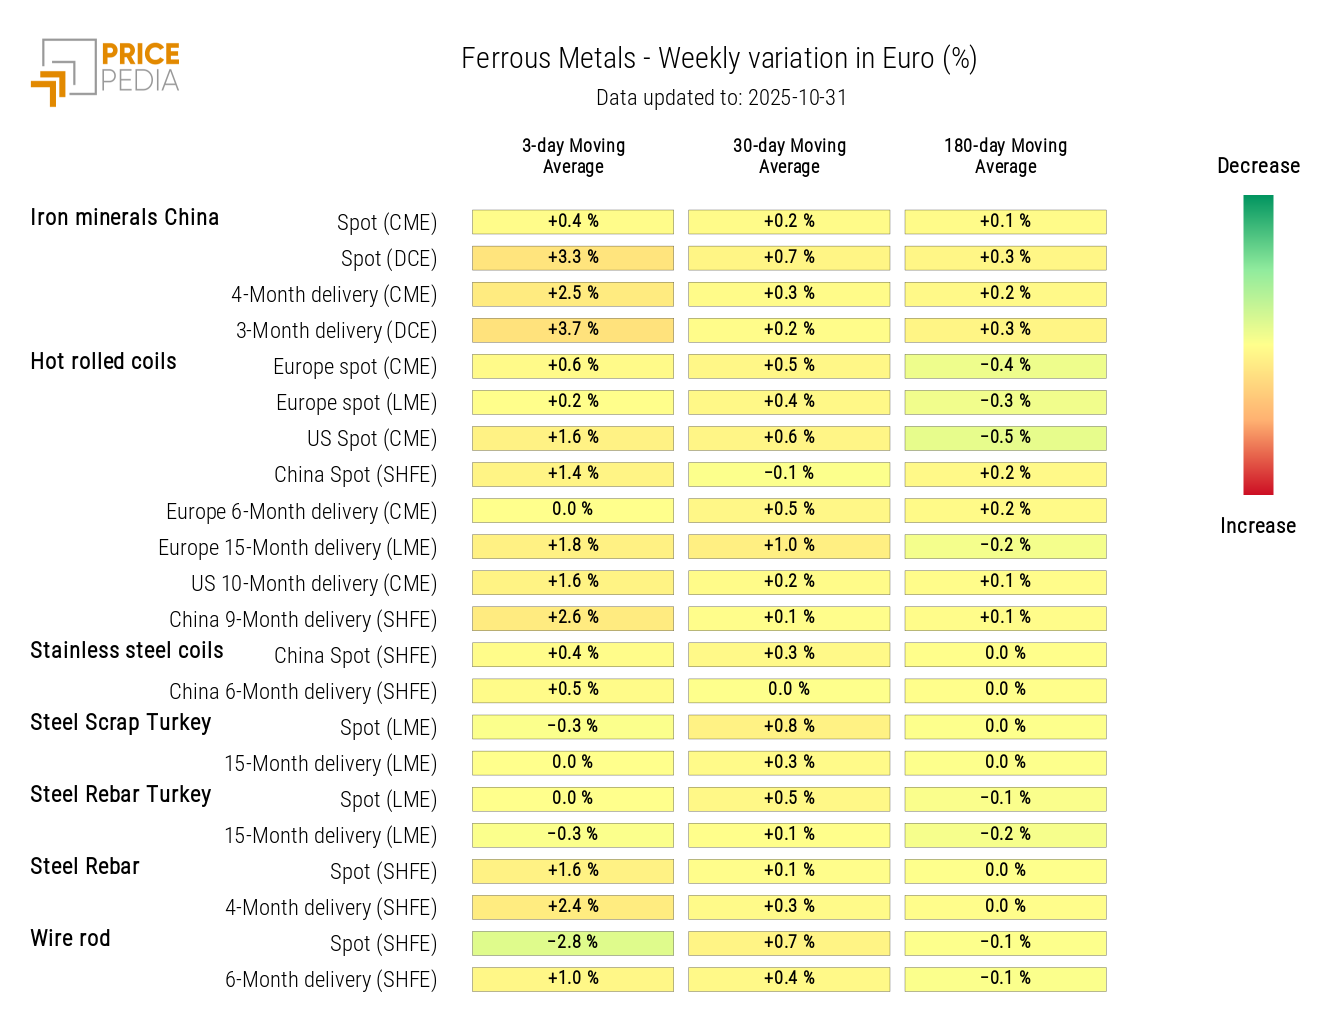
Trade easing also affected the price dynamics of some industrial metals, supporting the recovery of ferrous metals in China, with stronger increases for iron ore traded on the Dalian Commodity Exchange (DCE). The European market, by contrast, followed a weekly downward trend due to sharper declines at the end of the week.
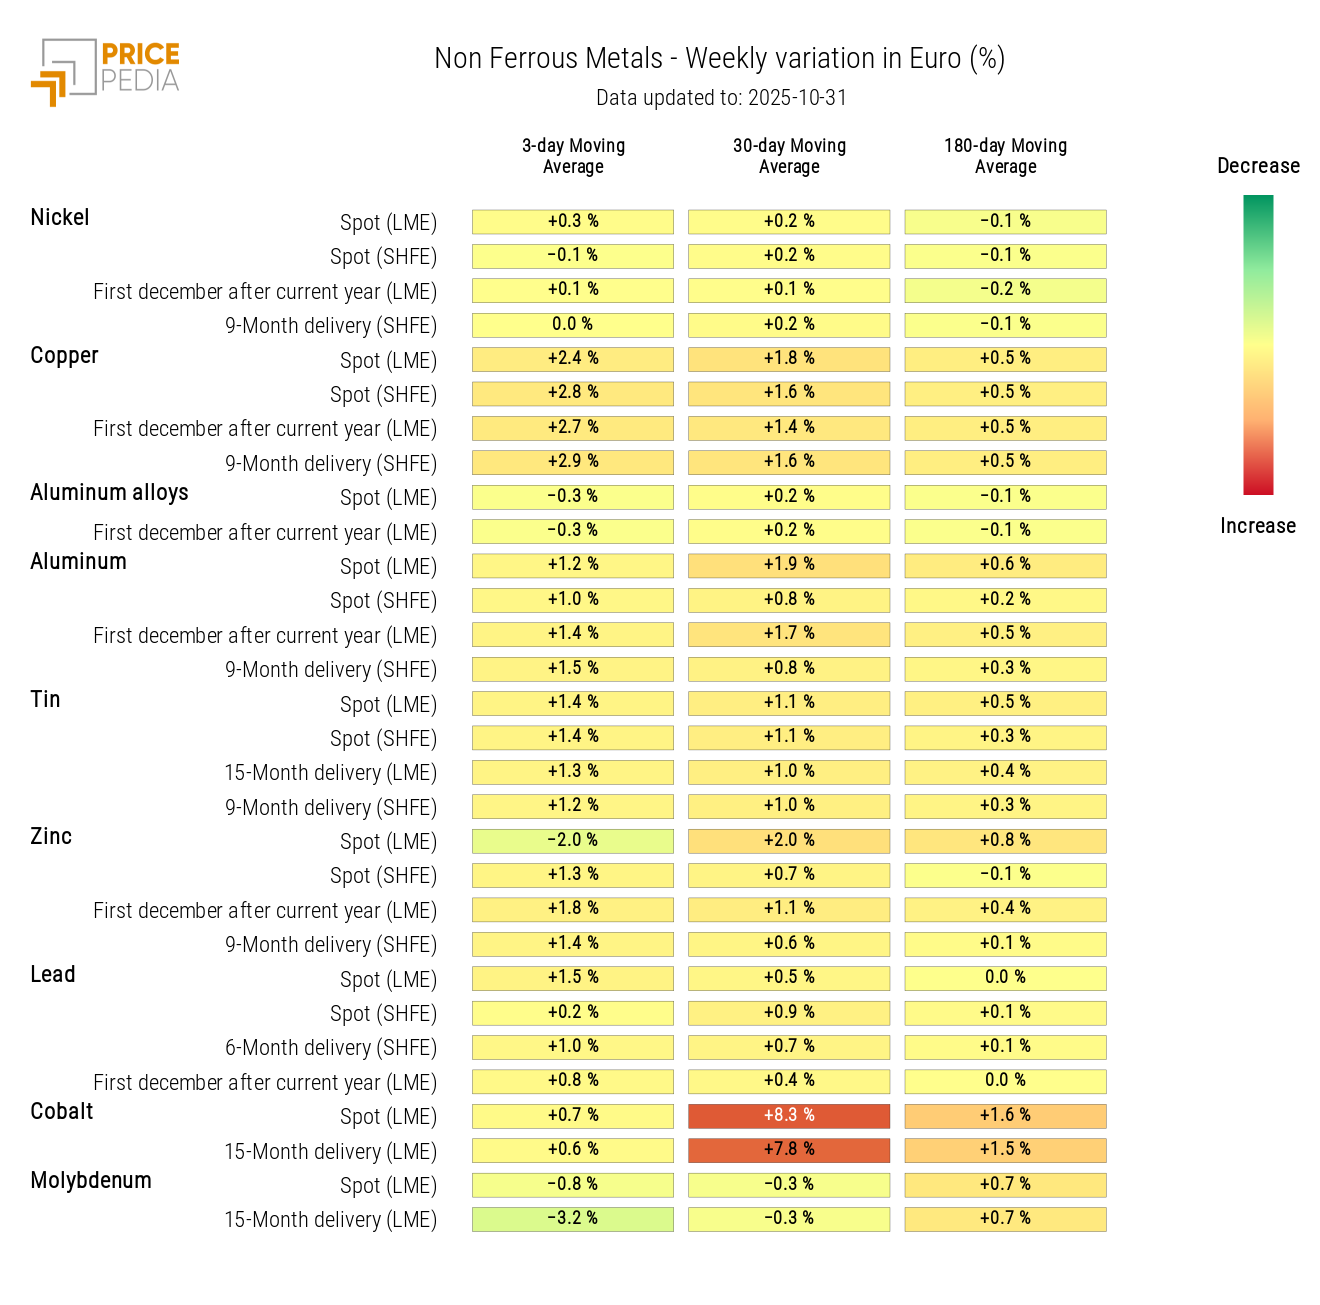
Among non-ferrous metals, copper prices on the LME increased, reaching new all-time highs above $11,000/ton. The positive outcome of trade negotiations between the U.S. and China eased concerns about Chinese demand, in a context of limited supply due to ongoing production disruptions.
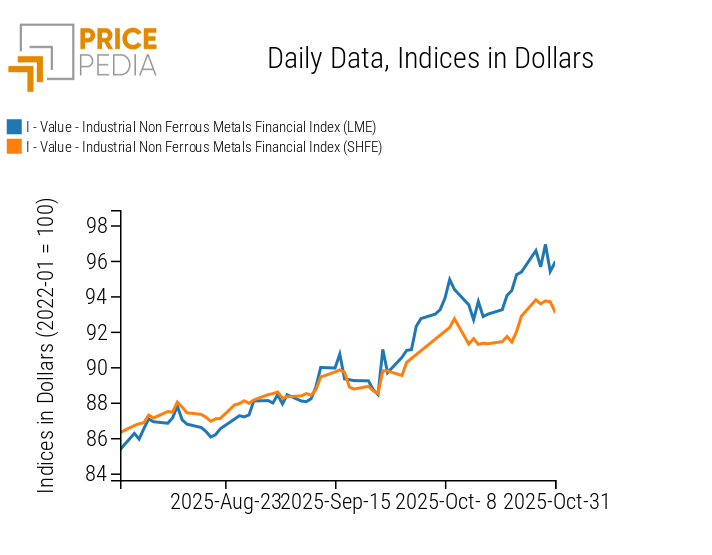
Overall, non-ferrous metals remained mostly sideways on the London Metal Exchange (LME), while the Shanghai (SHFE) market recorded a slight increase in base metals.
In the agricultural commodities sector, prices of grains rose, tropical products declined, and edible oils remained relatively stable.
Among grains, the largest changes involved financial prices of soybeans, both seeds and meal.
Following recent positive developments in U.S.–China trade talks, Beijing announced the resumption of U.S. soybean purchases, with imports reaching 12 million tons by January and at least 25 million tons per year over the next three years.
These volumes are consistent with pre–trade war levels: China is the main destination for U.S. soybeans. In 2024, it imported 25 million tons of soybeans from the United States — over five times the amount imported by Mexico, the second-largest buyer.
In the tropicals segment, prices of coffee, cocoa, and sugar declined, with the sharpest drop in sugar prices due to higher sugarcane production in Brazil’s Center-South region.
Monetary Policies
This week, both the Federal Reserve and the European Central Bank held their monetary policy meetings.
The FED opted for a 25 basis point interest rate cut, as widely expected by analysts. However, Chair Powell emphasized that further cuts are far from certain, citing economic uncertainty and limited data availability due to the government shutdown.
On the European front, the ECB kept rates unchanged, noting that inflation remains close to the 2% target and that the macroeconomic outlook is resilient despite global tensions. President Lagarde reiterated that future decisions will remain fully data-dependent and will be made meeting by meeting, without pre-commitments on rate trajectories.
NUMERICAL APPENDIX
ENERGY
Net of fluctuations, this week the PricePedia financial index for energy shows a decline in prices.
PricePedia Financial Index of Energy Prices in USD
The heatmap analysis of energy commodities shows relative stability in weekly oil prices, alongside increases in its derivatives such as gasoline and diesel.
For natural gas, Dutch TTF prices recorded modest weekly changes, while U.S. Henry Hub prices continued their recent upward trend.
HeatMap of Energy Prices in EUR
PRECIOUS METALS
The financial index of precious metals followed a decline linked to the easing of trade tensions, recovering only partially over the weekend.
PricePedia Financial Index of Precious Metal Prices in USD
The precious metals heatmap shows a weekly decline in the 3-day moving average of gold prices.
HeatMap of Precious Metal Prices in EUR
FERROUS METALS
The two financial indices for ferrous metals indicate a price recovery in the Chinese market and overall stability in the European one.
PricePedia Financial Indices of Ferrous Metal Prices in USD
The ferrous metals heatmap highlights rising prices for DCE iron ore and steel rebar.
HeatMap of Ferrous Metal Prices in EUR
Do you want to stay up-to-date on commodity market trends?
Sign up for PricePedia newsletter: it's free!
NON-FERROUS INDUSTRIAL METALS
This week, the LME non-ferrous metals financial index showed mixed price movements, while the index of non-ferrous metals traded in Shanghai recorded a slight increase.
PricePedia Financial Indices of Non-Ferrous Industrial Metal Prices in USD
The non-ferrous metals heatmap shows rising copper prices and declining LME zinc prices.
HeatMap of Non-Ferrous Metal Prices in EUR
AGRICULTURAL COMMODITIES
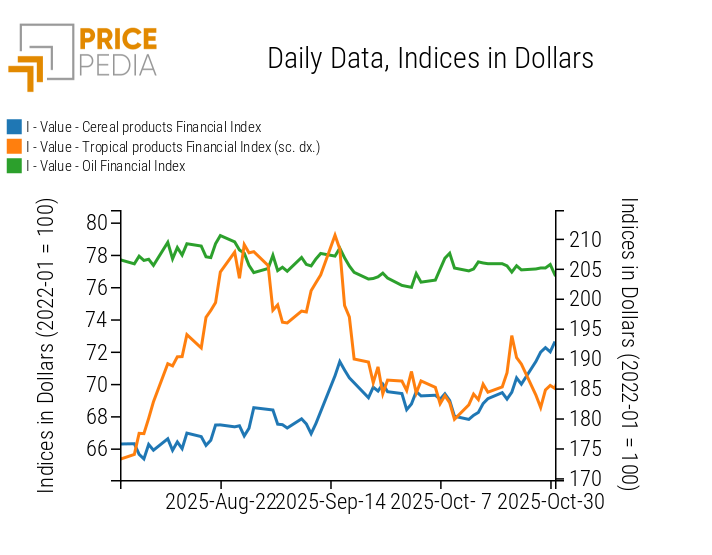
The three financial indices for agricultural commodities show different weekly trends: grains continue to rise, tropicals decline, and oils remain stable.
PricePedia Financial Indices of Agricultural Commodity Prices in USD
CEREALS
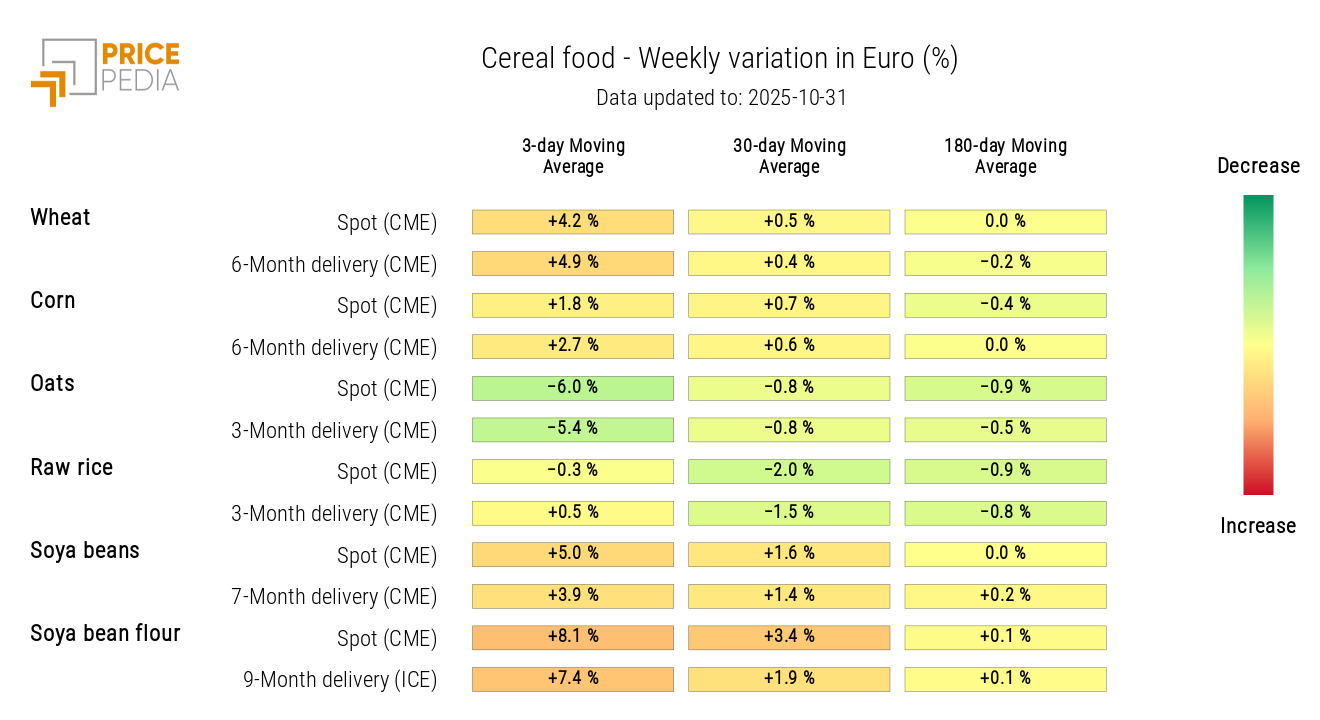
Except for oats, the cereal heatmap shows a general price increase, especially for soybeans.
The drop in oat prices is mainly due to increased global supply, with the EU playing an important role — its production rose by 31.4% in the 2023/2024 marketing year and is expected to grow by another 15.9% in 2025/2026.[1]
HeatMap of Cereal Prices in EUR
TROPICAL PRODUCTS
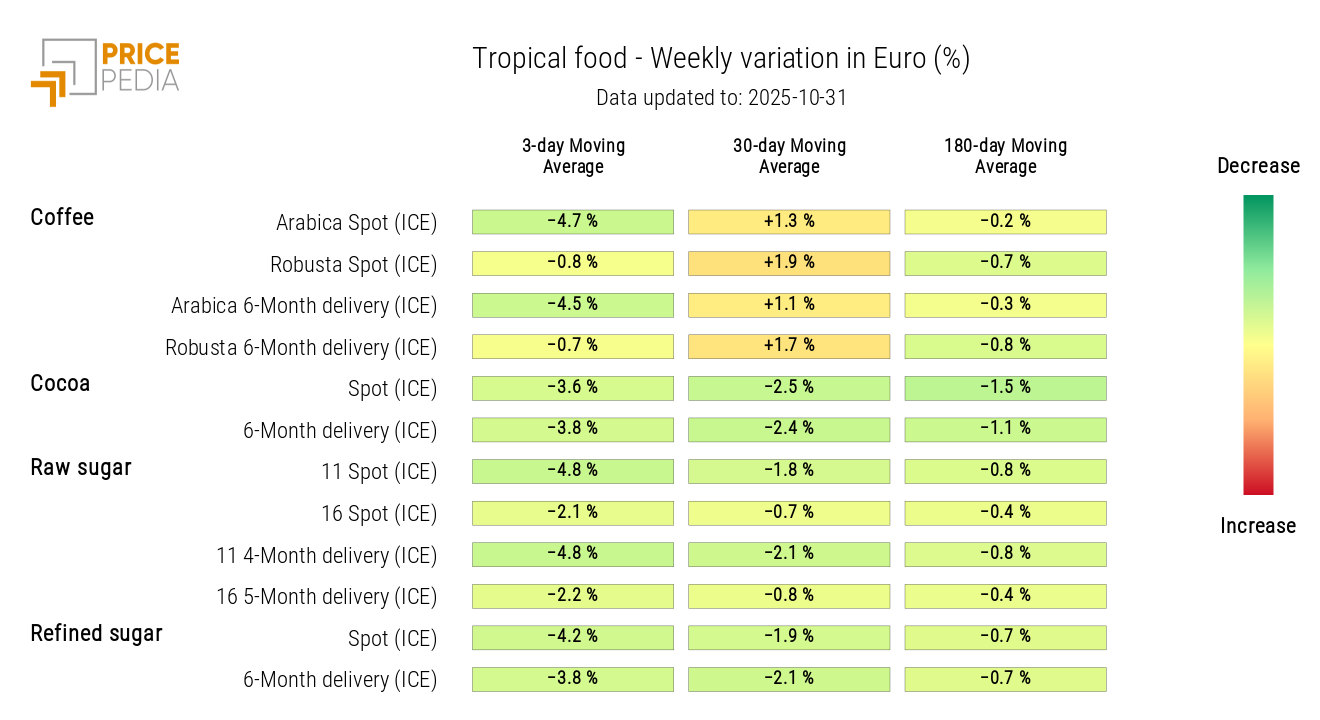
The tropicals heatmap turns green, indicating a broad-based price decline.
HeatMap of Tropical Commodity Prices in EUR
OILS
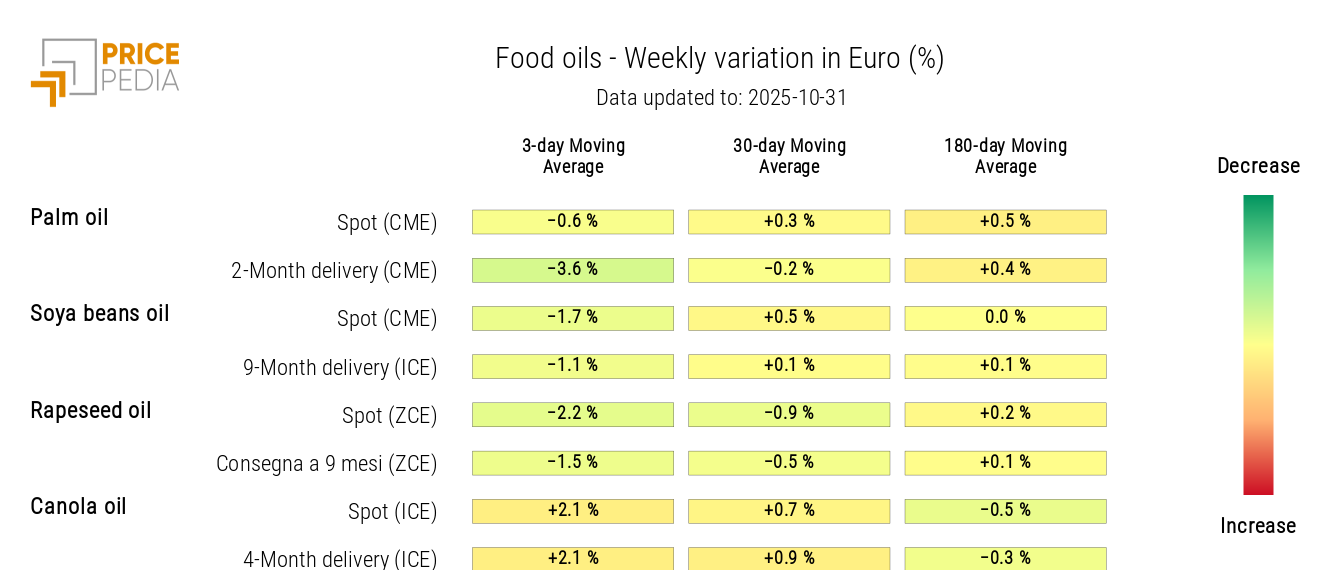
The heatmap of edible oils shows rising prices for canola oil and a decline for rapeseed oil.
HeatMap of Edible Oil Prices in EUR
[1] Source: Report: Cereals market situation


