Market concentration and commodity risk
A measure of structural scarcity for commodities
Published by Pasquale Marzano. .
Procurement Procurement Risk Management
In the article Commodity substitutability as a factor mitigating the risk of structural scarcity, the analysis focused on how the ability to replace one commodity with another in production processes can be an effective tool to mitigate the risk of structural scarcity of a raw material.
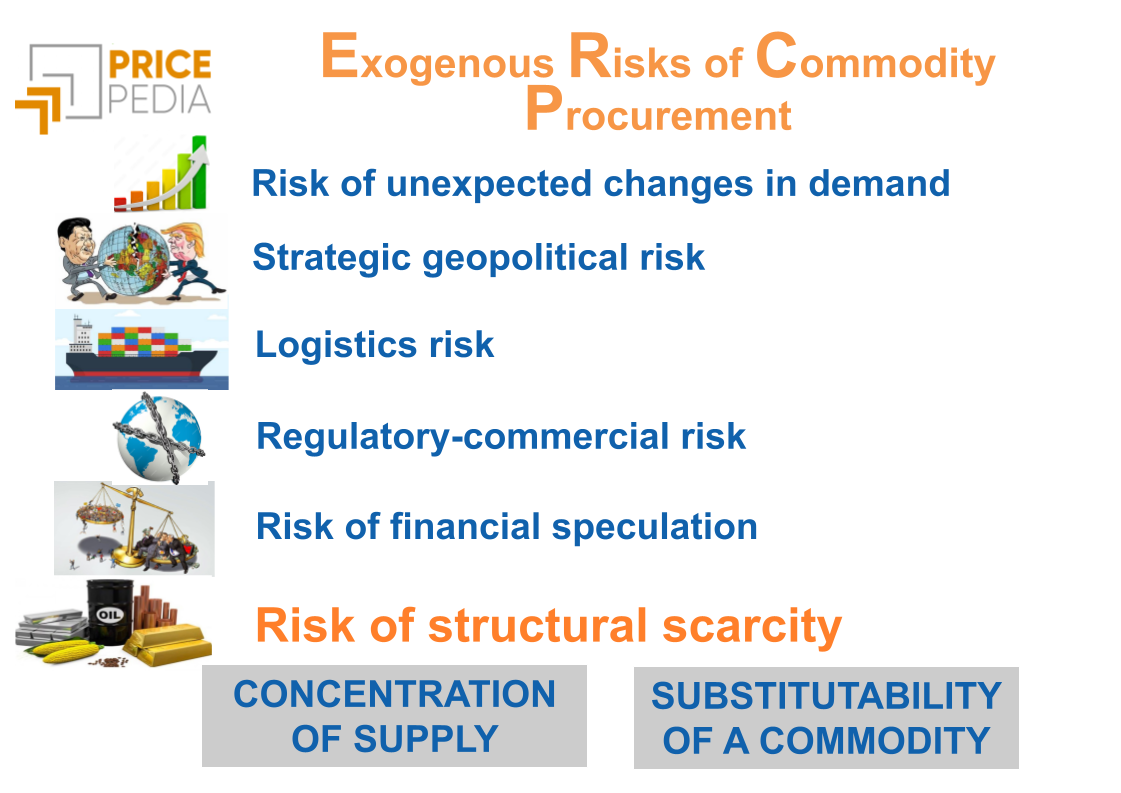
Within the project for measuring exogenous supply risks of a commodity, the risk of structural scarcity occurs when the availability of a commodity is limited by deep and persistent causes of a physical, geological, environmental, or industrial nature. Unlike temporary scarcity, linked to exogenous events or short-term shocks, structural scarcity arises from long-term factors such as:
- the depletion of economically accessible natural resources;
- a decline in investment in exploration or extraction capacity;
- environmental or social constraints on production (for example, ESG regulations or decarbonization goals);
- a structural increase in global demand, driven by phenomena such as the energy transition, digitalization, and the growth of emerging countries.
This type of risk can generate increasing price pressures, geopolitical conflicts over access to resources, and a growing focus on sustainable sourcing strategies, technological innovation, and recycling.
A Measure of Market Concentration
Beyond the (absence of) substitutability between commodities, a useful indicator for estimating structural scarcity is the number of firms operating in the market. A commodity produced by many firms is generally less subject to supply concentration. However, this indicator should be interpreted with caution: a commodity may have many producers, but if the bulk of volumes comes from one or two dominant firms, the market remains vulnerable — especially if those firms are concentrated in a few countries, making the commodity also exposed to geopolitical risks.
A representative measure of market concentration can be constructed using the Herfindahl-Hirschman Index (HHI). This index is commonly used to measure the degree of competition in a given market and is calculated as the sum of the squares of the market shares held by firms.
However, information on the number of firms operating within a specific market and their respective market shares is available only for a limited number of products. An alternative and likely representative measure of supply concentration for a product market can be obtained by considering the number of exporting countries.
Do you want to stay up-to-date on commodity market trends?
Sign up for PricePedia newsletter: it's free!
Market Concentration within the REAC Project
Within the project for measuring the Exogenous Risks of Commodity Supply (Rischi Esogeni di Approvvigionamento di una Commodity: REAC), knowing the level of market concentration of a commodity allows a better assessment of the vulnerability of the supply chain of a firm, as well as that of suppliers. This knowledge also enables effective risk mitigation actions.
To measure the risk of structural scarcity of a commodity due to the degree of supply concentration, for each product the export concentration of different countries is considered at the global level. In particular, to filter out the effect of countries that act as trading hubs (such as the Netherlands, Belgium, etc.), the share of each country's net exports is calculated.
The following concentration levels are identified:
- low concentration (values 0-15),
- moderate concentration (values 15-25),
- high concentration (values 25-60),
- very high concentration (values 60-100).
Results
The analysis was carried out considering global trade flows in the 2023-2024 period for more than 900 products included in PricePedia's EU Customs database.
The results highlight the predominant role of China: for over 50% of the products showing a very high market concentration (index between 60 and 100), the Asian giant is the leading global supplier.
The table below reports the results on supply concentration for a selection of products. Alongside each product's concentration index value, the main global exporter and its corresponding share of net exports are shown.
Degree of concentration and main global supplier for a selection of products
| Product | Concentration Index |
Main Exporter | Net Export Share of Main Exporter (%) |
|---|---|---|---|
| Jute yarns | 100.0 | Bangladesh | 99 |
| Magnetized permanent magnets | 99.7 | China | 99 |
| Processed cashmere hair | 88.9 | China | 94 |
| Cobalt oxides and hydroxides | 80.8 | Democratic Republic of the Congo |
89 |
| Lysine | 75.9 | China | 86 |
| Ferro-nickel | 73.5 | Indonesia | 85 |
| Lithium carbonates | 70.6 | Chile | 82 |
| Chromium ores | 68.8 | South Africa | 82 |
| DRAM Memory Capacity > 512Mbit | 66.6 | South Korea | 80 |
| Cellulose acetate | 61.5 | USA | 75 |
| Ammonium chloride | 59.4 | China | 75 |
| Multilayer ceramic capacitors | 56.0 | Japan | 73 |
| Refined non-liquid coconut oil | 55.3 | Philippines | 72 |
Jute yarns record the highest concentration: they are produced almost exclusively in Bangladesh. Magnetized permanent magnets also show a very high market concentration. In this case, China dominates the supply on international markets. It is not surprising that the Chinese government's announcement of new export controls on rare earths and related products (including magnets) raised concerns among Western partners and, not least, prompted the reaction of U.S. President Donald J. Trump, who announced the reintroduction of 100% tariffs on Chinese goods.
Among the products with very high concentration levels and where China holds a share of exports above 80%, noteworthy examples include Processed cashmere hair and Lysine, recently analyzed in the article China effect on the EU Market: the case of Lysine.
Other products with high concentration levels include those linked to metals used in energy transition technologies — such as Cobalt oxides and hydroxides and Lithium carbonates — to products used in the digital transition - such as DRAM Memory Capacity > 512Mbit and Multilayer ceramic capacitors - and to ores and ferroalloys used in stainless steel production — such as Ferro-nickel and Chromium ores.
Conclusions
The analysis presented in this article highlights how the predominance of a small number of players in the production and export of many purchasing materials makes global supply chains more vulnerable to political, regulatory, or logistical shocks. In this context, a measure identifying the concentration of product markets, combined with an assessment of commodity substitutability, can represent the main lever for mitigating the risk of structural scarcity.
You may be interested in:
Commodity substitutability as a factor mitigating the risk of structural scarcity
Published by Luigi Bidoia. .
Procurement Procurement Risk ManagementUna misura indiretta della sostituibilità: la correlazione tra i prezzi delle commodity [ Read all ]
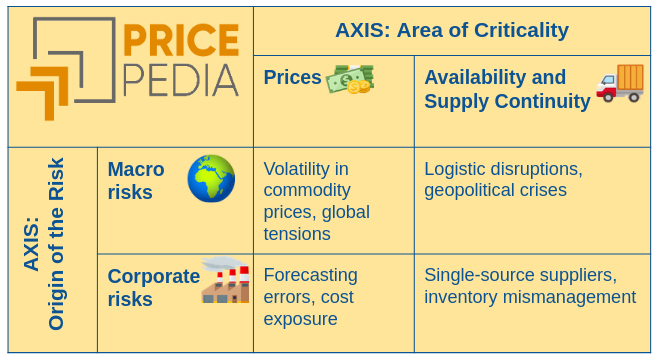
Macro commodity risks and corporate procurement risks
Published by Cristina Luca. .
Procurement economic analysis Procurement Risk ManagementHow procurement management is evolving in an uncertain world [ Read all ]
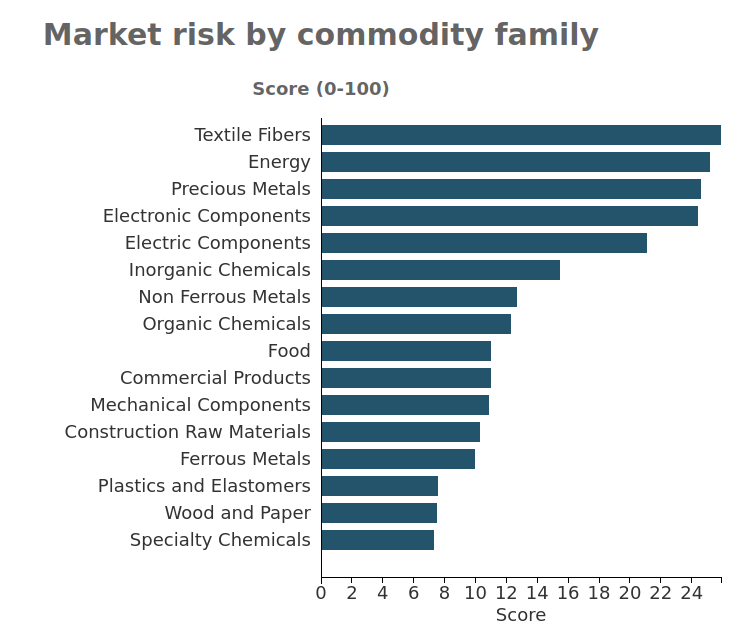
PricePedia commodity market risk
Published by Luigi Bidoia. .
Strumenti Procurement Procurement Risk ManagementSu un totale di 700 commodity, 84 hanno uno score superiore a 30 [ Read all ]