PricePedia Scenario for October 2025
Downward pressure on commodity prices in 2025-2026
Published by Pasquale Marzano. .
Forecast ForecastThe PricePedia Scenario has been updated with information available as of October 2, 2025. In addition to the deterioration of global trade relations triggered by the U.S. tariff policy, recent geopolitical tensions, most recently exemplified by airspace violations over several European and NATO countries, continue to hold back the full recovery of global commodity demand. In this context, the recent increases in the prices of major commodities on financial markets observed last week were mainly driven by supply concerns rather than by signs of a genuine recovery in demand (see the articles Fears of supply shortages drive up copper prices and Fears over supply fuel gains in Non Ferrous Metals).
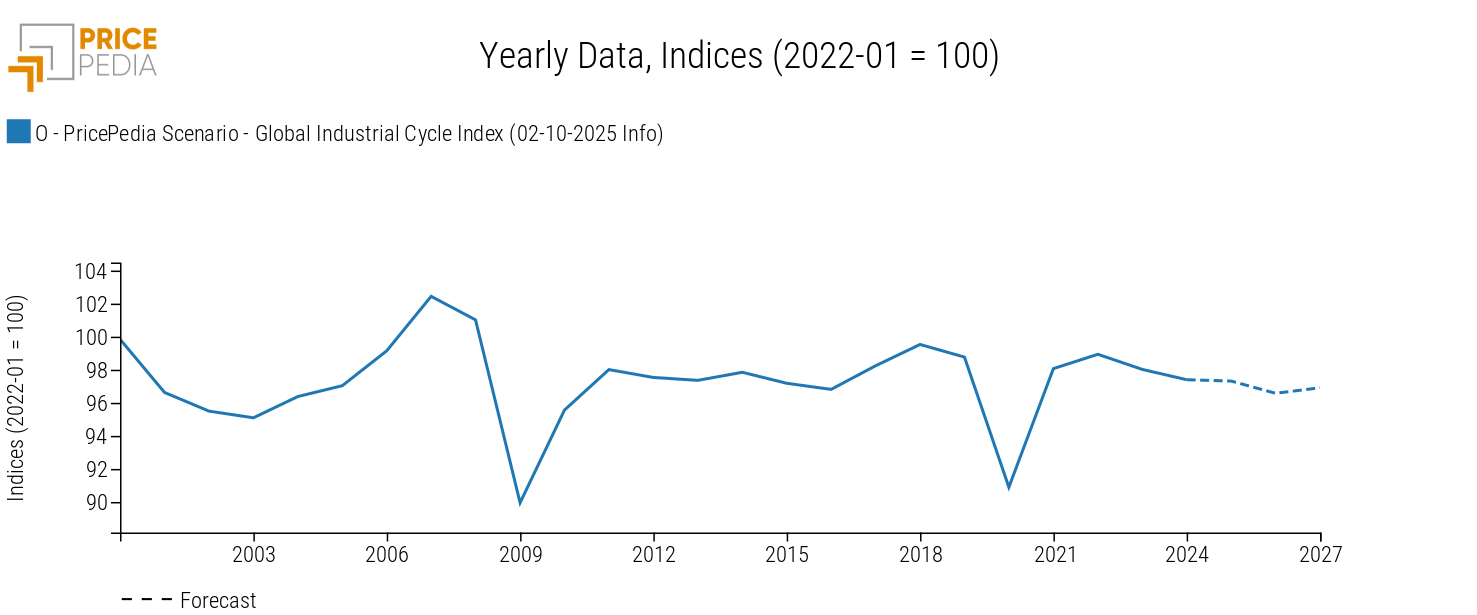
The graph below shows the 24-month forecast of the global industrial cycle index[1] elaborated by PricePedia, which reflects the growth outlook for global commodity demand.
Global Industrial Cycle, October 2025 Scenario

On average, in 2025, the industrial cycle is expected to remain at the low levels recorded in 2024, showing a -1.6% decline compared to the peak reached in 2022, the highest point of the last five years. In 2026, the index is projected to decrease further by -0.8% compared to average of the previous year.
On an annual basis, a slight improvement is expected in 2027.
Do you want to stay up-to-date on commodity market trends?
Sign up for PricePedia newsletter: it's free!
The forecast for purchasing material prices
The downward trend projected for the global industrial cycle is expected to exert bearish pressure on the prices of industrial purchasing materials over the next two years. Specifically, on average in 2025, euro-denominated commodity prices are forecast to decline by -6.3% compared to the 2024 average. In 2026, prices are expected to continue following the downward trend of recent years, posting an annual variation rate of -6.9%.
The table below shows the annual percentage changes in euro-denominated prices for the main commodity aggregates included in the PricePedia Scenario: Industrial[2], Total Commodity[3], Energy, and Food.
Table 1: Annual Percentage Changes (%) of PricePedia Aggregate Indices, in Euro
| 2024 | 2025f | 2026f | 2027f* | |
|---|---|---|---|---|
| I-PricePedia Scenario-Commodity Index (Europe) (02-10-2025 Info) | −4.53 | −6.34 | −6.89 | −0.80 |
| I-PricePedia Scenario-Energy Total Index (Europe) (02-10-2025 Info) | −5.88 | −13.23 | −13.11 | −1.99 |
| I-PricePedia Scenario-Food Total Index (Europe) (02-10-2025 Info) | +3.08 | +9.92 | −2.04 | −2.98 |
| I-PricePedia Scenario-Industrials Index (Europe) (02-10-2025 Info) | −4.53 | −2.57 | −1.11 | +1.26 |
Among the main aggregates, energy commodities are expected to experience a price drop of around -13% both in 2025 and 2026. This forecast is influenced by expectations of increased production by OPEC+ member countries, which could lead to an oversupply situation. In this context, the price of Brent crude oil is projected to remain slightly below USD 65 per barrel.
Following a -4.5% decline in 2024, prices of core industrial commodities are expected to continue their downward trajectory. The projected -2.6% decline in European prices this year is partly influenced by the corresponding downward trend in Chinese commodity prices, as discussed in the Monthly commodity prices update for September 2025. European prices are expected to continue decreasing in 2026, albeit at a slower pace of -1.1%.
As for food commodities, after the increase projected for this year, prices are expected to stabilize in 2026 at levels approximately -2% lower than the 2025 average.
1. The global industrial cycle index is constructed by purifying the actual dynamics of industrial production from its trend. Since the supply of commodities tends to vary according to long-term economic growth expectations, while the demand for commodities is more linked to actual cyclical uses, the global industrial cycle index tends to reproduce the conditions of tension between demand and supply on the commodity market: when it increases, it means that the demand for commodities increases more than the supply; vice versa when it decreases.
2. The PricePedia Industrials index results from the aggregation of the indices relating to the following product categories: Ferrous, Non-Ferrous, Wood and Paper, Chemicals: Specialty, Organic Chemicals, Inorganic Chemicals, Plastics and Elastomers and Textile Fibres.
3. The PricePedia Commodity index results from the aggregation of the indices relating to industrial, food and energy commodities.


