Supply concerns fuel growth in non-ferrous metals
The U.S. shutdown accelerates the growth of precious metals
Published by Luca Sazzini. .
Conjunctural Indicators Commodities Financial WeekThis week, financial commodity prices were characterized by high volatility, with contrasting trends across different sectors.
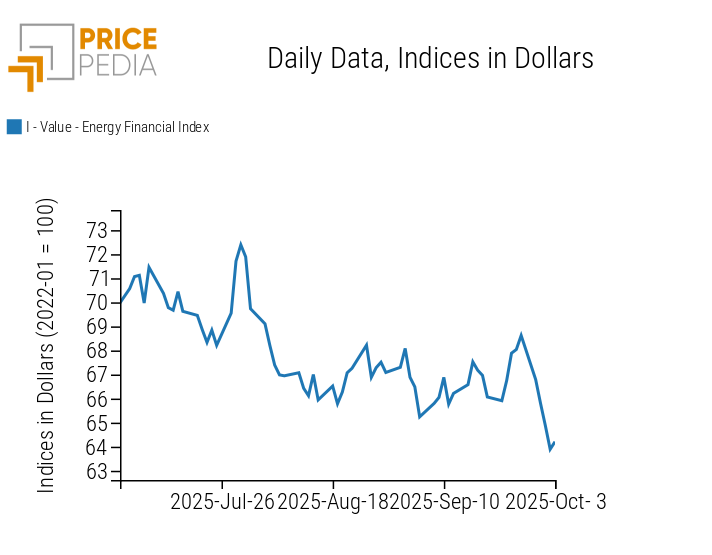
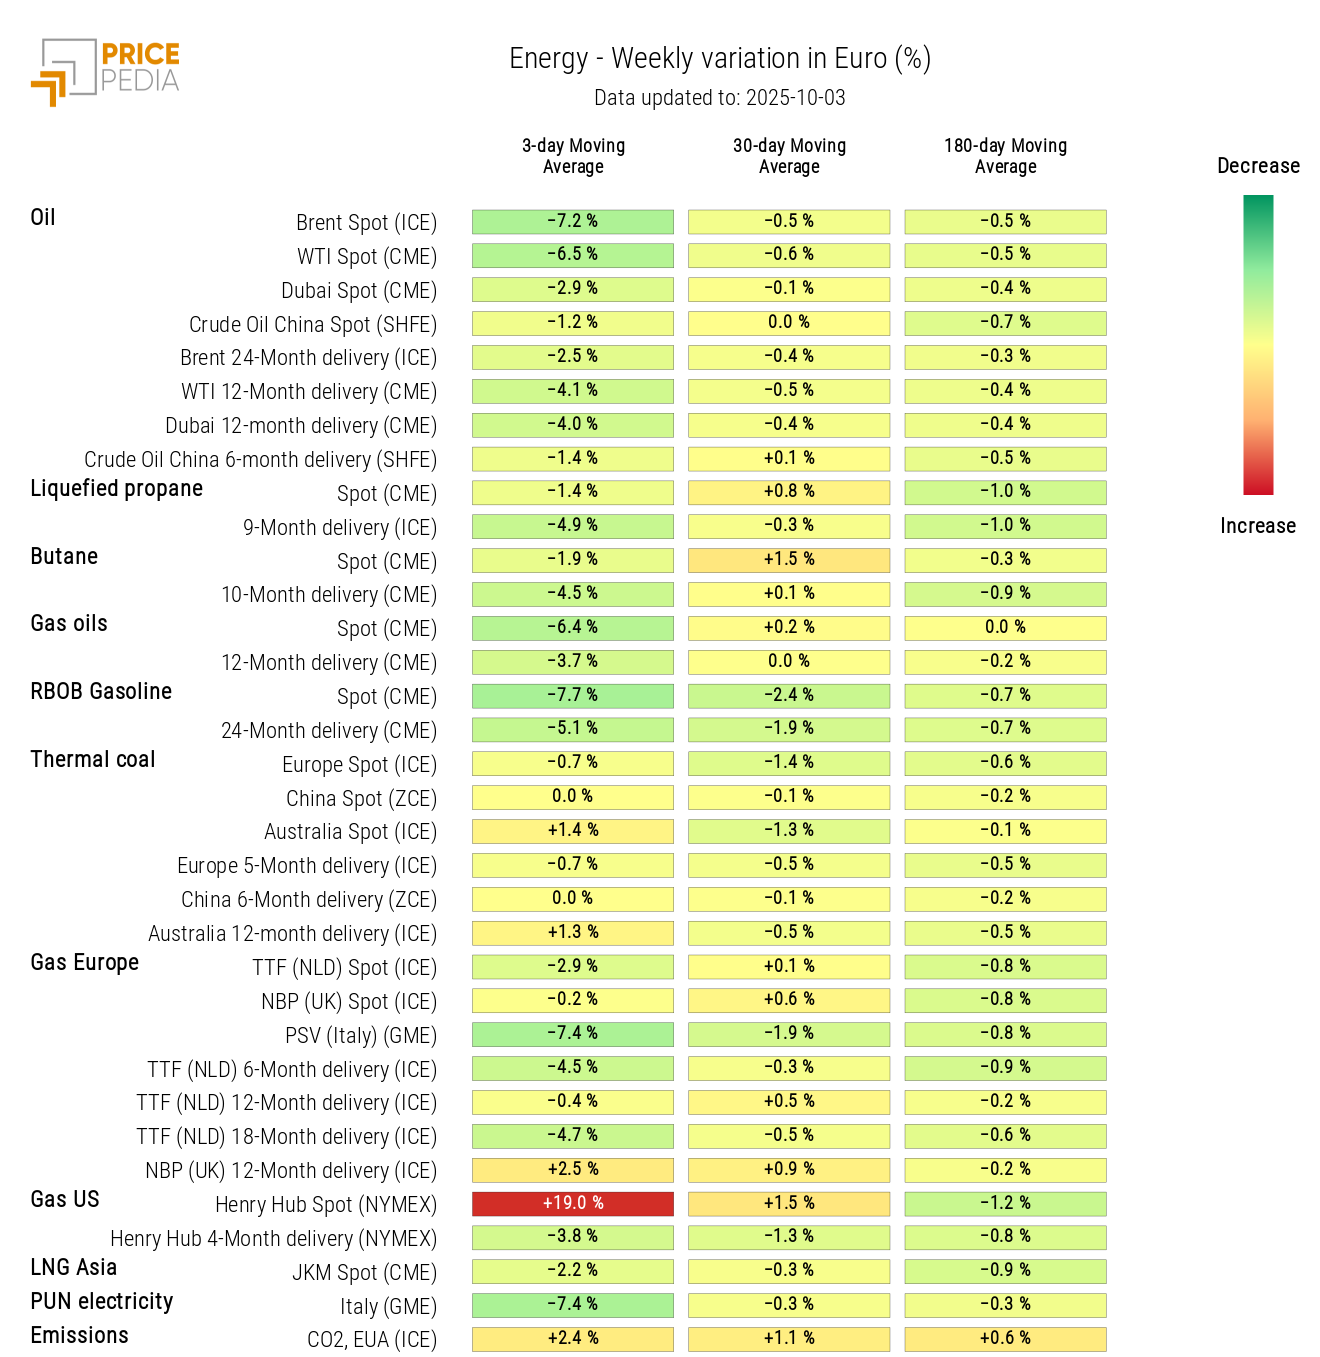
Energy prices experienced a sharp decline, completely erasing the gains from the previous week. The most pronounced drops involved oil and its derivatives, weighed down by fears of a further increase in supply from OPEC+ in November.
Prices of European natural gas TTF (Netherlands) also recorded weekly declines, influenced by weak Chinese demand, which supported the EU’s storage operations ahead of the winter season. Meanwhile, gas flows from Norway are gradually resuming after periods of intensive maintenance, while mild early October temperatures are delaying the seasonal increase in residential heating demand.
In contrast, U.S. natural gas Henry Hub prices rose significantly this week, driven by slower production and a smaller-than-expected rise in inventories.
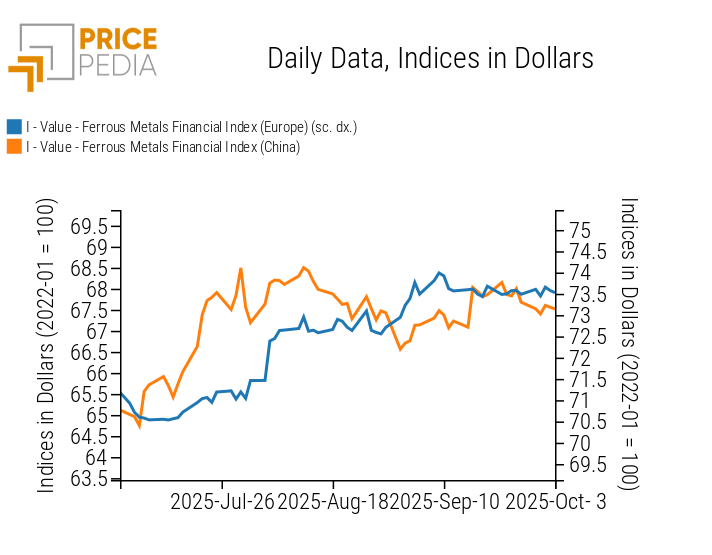
In the ferrous metals markets, heterogeneous dynamics were observed between Europe and China: European prices remained relatively stable, while Chinese prices fell following the release of negative data from China’s steel PMI.
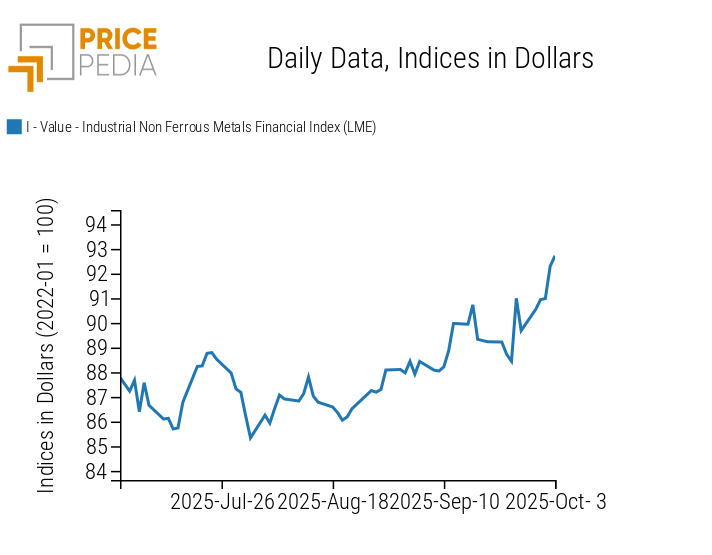
In the non-ferrous metals sector, prices increased due to news from China: the Ministry of Industry and Information Technology (MIIT) reduced the annual growth target for the production of the 10 main non-ferrous metals for 2025–2026 to an average of 1.5% per year. This marks a strategic shift from expanding volumes to improving efficiency and sustainability, aimed at curbing the excess supply accumulated after years of rapid capacity expansion. At the same time, China’s roadmap seeks to increase recycling rates and strengthen the reuse of spent batteries, solar panels, and other waste materials.
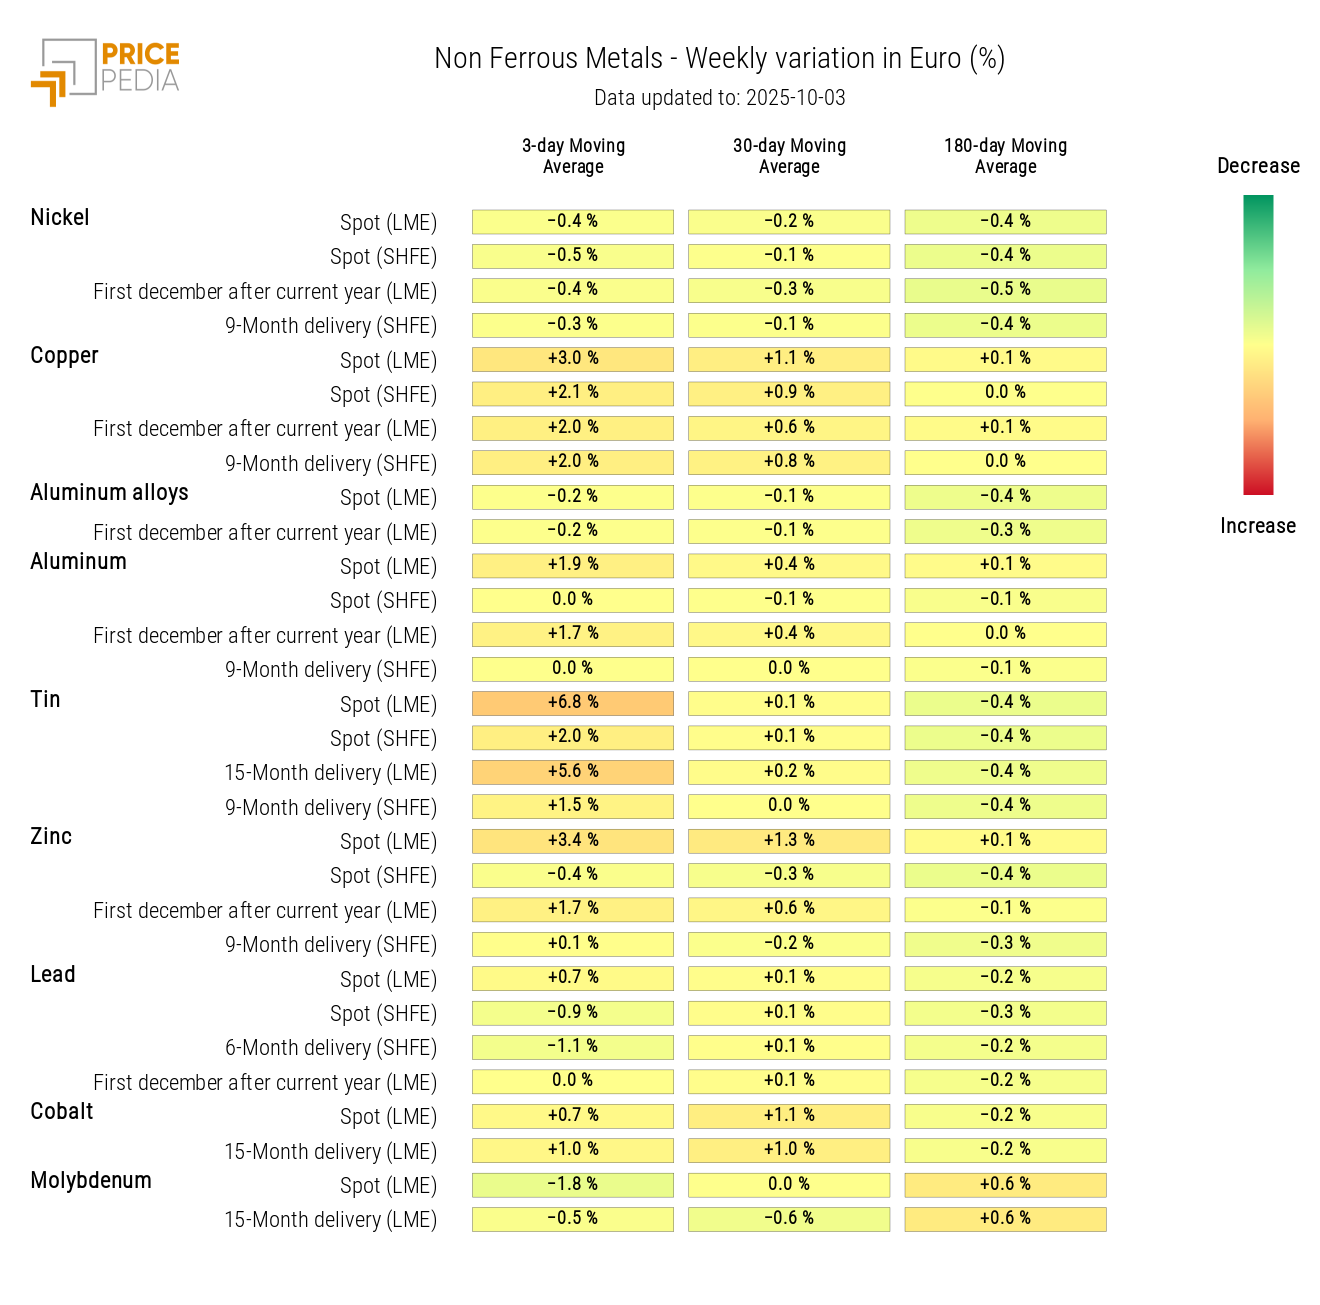
Among the metals driving the upward trend were mainly tin, zinc, and copper. The price of tin rose not only due to the reduced Chinese production growth target but also because of recent disruptions in its supply chain, exacerbated by Indonesia’s crackdown on illegal mining. Copper, on the other hand, continued last week’s upward trend, driven by supply concerns after a fatal accident at Freeport-McMoRan’s Grasberg mine in Indonesia and the shutdown of a Hudbay Minerals facility in Peru.
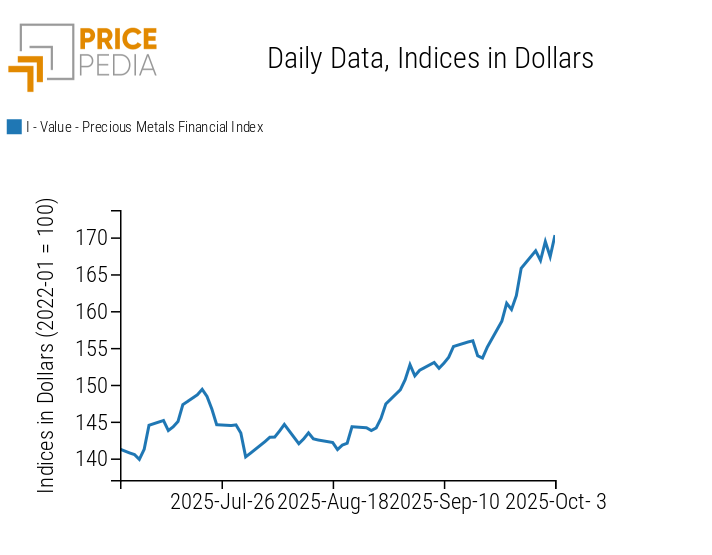
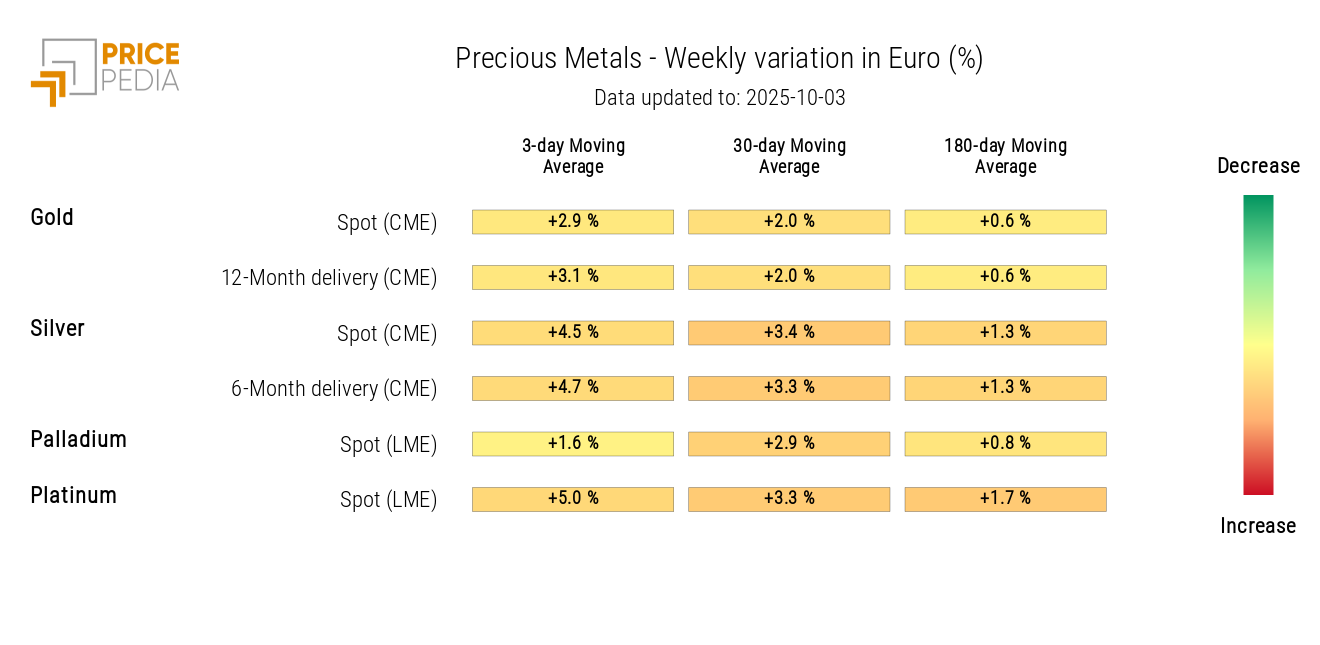
The sharpest increases, however, were recorded among precious metals, boosted by the U.S. government shutdown, which fueled a broad rise in safe-haven assets. The price of gold approached the $3,900 per troy ounce threshold, while silver reached $47 per troy ounce, setting new all-time highs for both.
U.S. Shutdown
As of October 1, 2025, the U.S. government officially entered a shutdown following the Senate’s failure to approve the temporary funding bill. The measure entails the immediate suspension of all non-essential public services, with the exception of strategic sectors—such as critical healthcare personnel and national defense services—which will continue operating without pay until new funding is approved by Congress. The shutdown has therefore put most federal employees on furlough and postponed the release of key U.S. macroeconomic data.
President Trump has threatened thousands of layoffs to address the crisis, prompting a reaction from federal unions, which have already initiated legal actions to protect workers.
NUMERICAL APPENDIX
ENERGY
The PricePedia Energy Index shows a new weekly decline, completely reversing last week’s gains.
PricePedia Financial Index of Energy Prices in USD
The energy heatmap highlights a reduction in oil and natural gas prices, except for Henry Hub, which shows a significant increase due to slower production in the United States.
HeatMap of Energy Prices in EUR
PRECIOUS METALS
The financial index for precious metals reached new all-time highs, fueled by the U.S. government shutdown and geopolitical tensions.
PricePedia Financial Index of Precious Metal Prices in USD
The precious metals heatmap shows a widespread increase in prices.
HeatMap of Precious Metal Prices in EUR
FERROUS METALS
The European ferrous metals index remained relatively stable, while the Chinese index declined due to negative data from China’s steel PMI.
PricePedia Financial Indices of Ferrous Metal Prices in USD
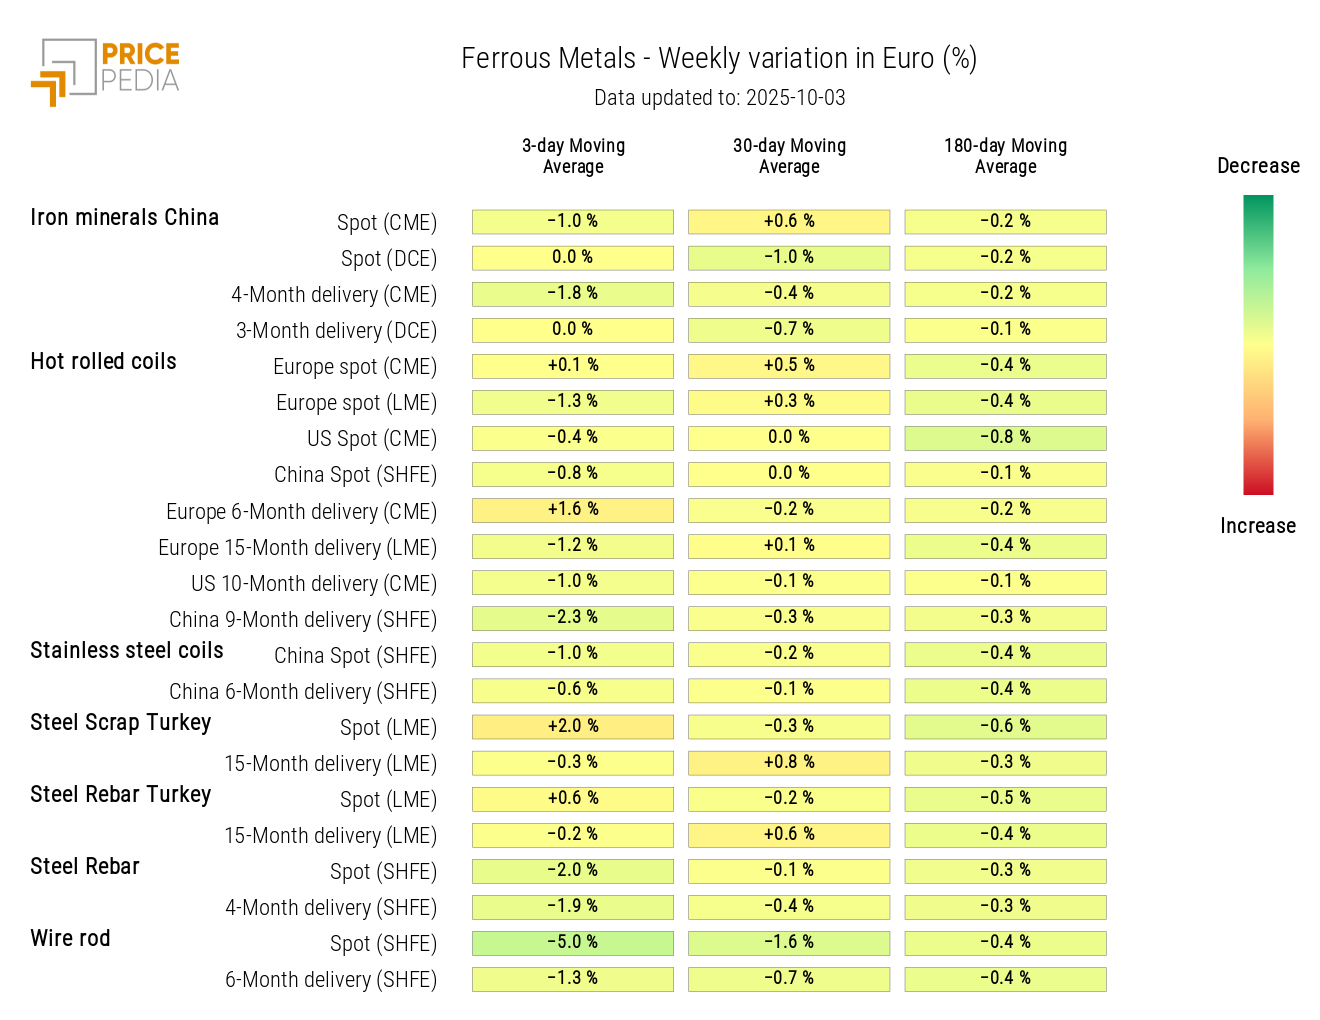
The ferrous metals heatmap indicates a weekly decline in wire rod prices.
HeatMap of Ferrous Metal Prices in EUR
Do you want to stay up-to-date on commodity market trends?
Sign up for PricePedia newsletter: it's free!
INDUSTRIAL NON-FERROUS METALS
The LME non-ferrous metals index continued its upward price trend.[1]
PricePedia Financial Indices of Industrial Non-Ferrous Metal Prices in USD
The non-ferrous metals heatmap shows a weekly rise in the moving average of tin, zinc, and copper prices.
HeatMap of Non-Ferrous Metal Prices in EUR
FOOD COMMODITIES
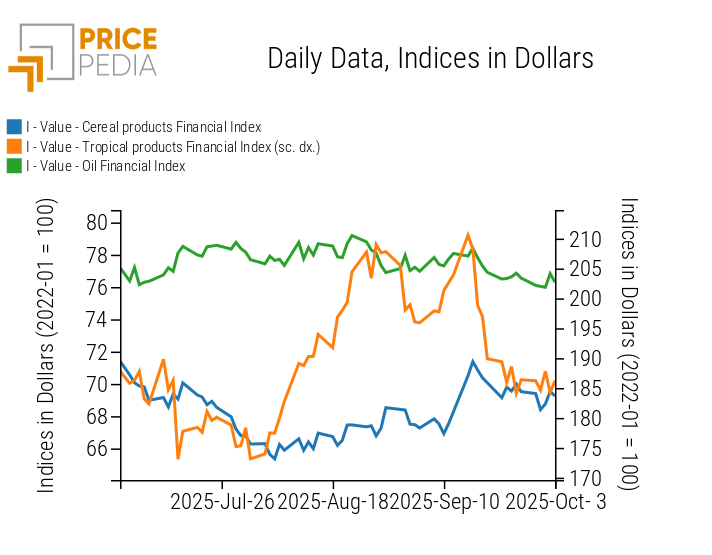
The financial indices for cereals and edible oils began the week with price declines, then partially recovered toward the weekend. The tropicals index, instead, showed opposing daily fluctuations that left its overall price level unchanged.
PricePedia Financial Indices of Food Commodity Prices in USD
CEREALS
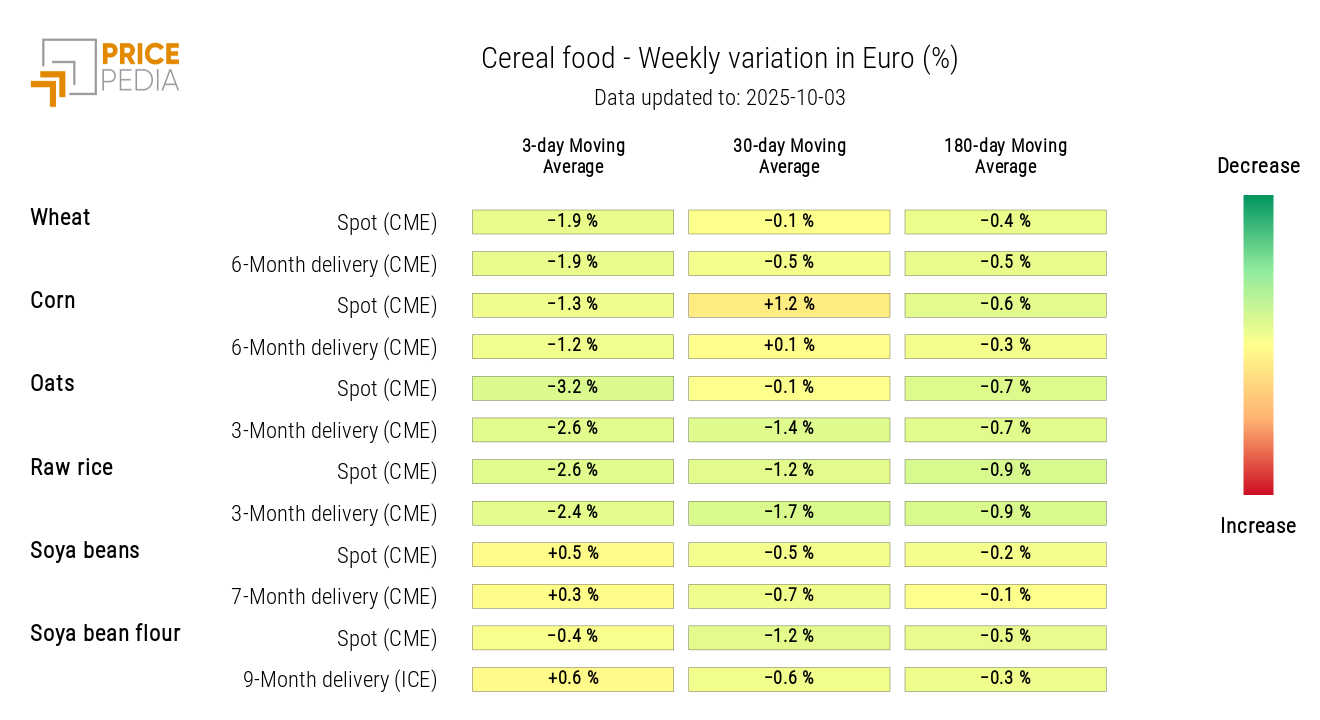
The cereals heatmap reveals a general weekly decline in euro-denominated prices.
HeatMap of Cereal Prices in EUR
TROPICALS
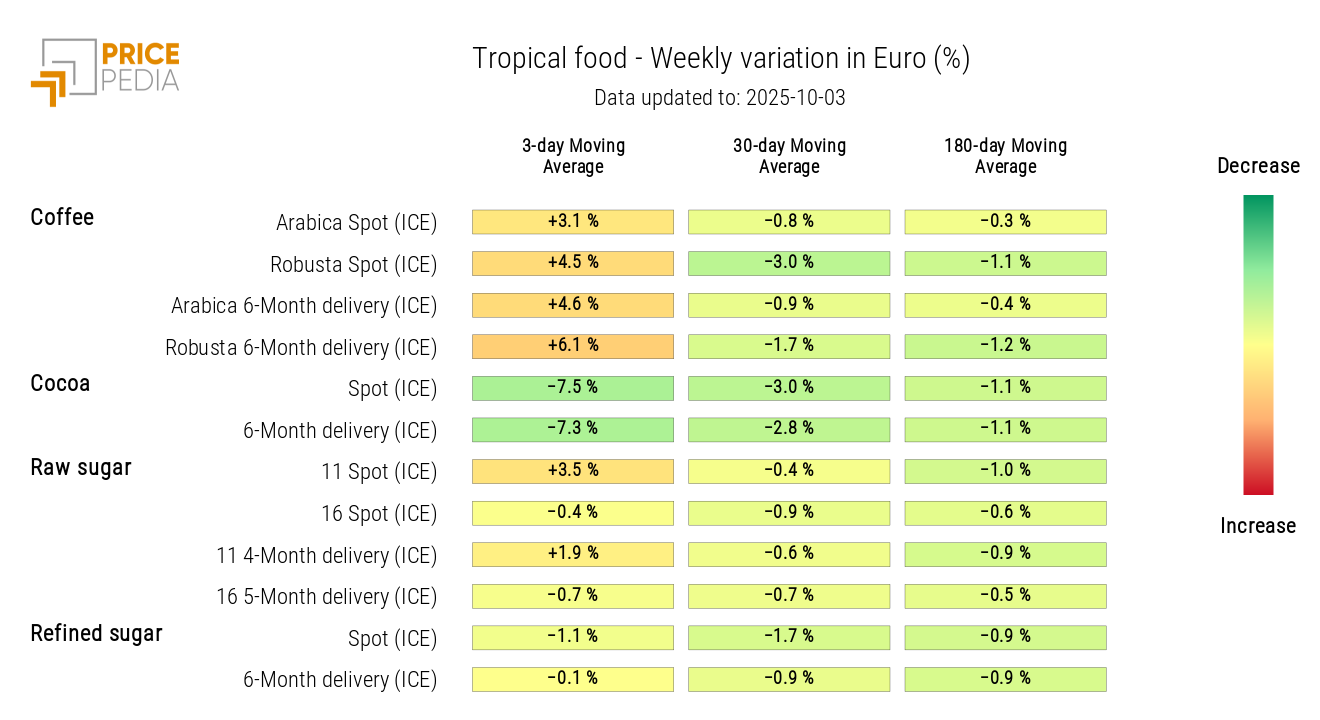
The tropicals heatmap shows a decline in cocoa prices, attributed to rising production in Côte d’Ivoire and Ghana, with the harvest season approaching. Price increases were instead observed for coffee and raw sugar no.11.
HeatMap of Tropical Food Commodity Prices in EUR
[1] This week, the dynamics of the Shanghai Futures Exchange (SHFE) index are not reported due to the Chinese market closure for the Golden Week holiday.

