Analysis of Aluminum Market Fundamentals Through 2050
Aluminium supply and demand: what are the long-term growth prospects?
Published by Luca Sazzini. .
Forecast Non Ferrous Metals Aluminium Analysis tools and methodologiesIn the article The use of relative prices to study the evolution of commodity markets it was highlighted how relative prices can represent a useful forecasting tool, as they make it possible to analyze not only the historical trend of individual commodities, but also the structural transformations that influence supply and demand balances, providing insights into future price prospects.
In particular, by comparing aluminum with copper and zinc, two substitute metals, it emerged that in the recent period the relative price of aluminum has grown less. This trend reflects a structural imbalance in the global market, where excess production capacity has dampened the growth of aluminum prices compared to copper and zinc. To further explore this dynamic, we will conduct an analysis of aluminum demand and supply, adopting Marshall’s equilibrium model as a theoretical reference to understand the mechanisms that determine long-term price formation in the aluminum market. We will also present some hypotheses on possible future developments of demand and supply, and finally provide a forecast scenario updated with the information available as of September 3, 2025.
Marshall’s Equilibrium Model
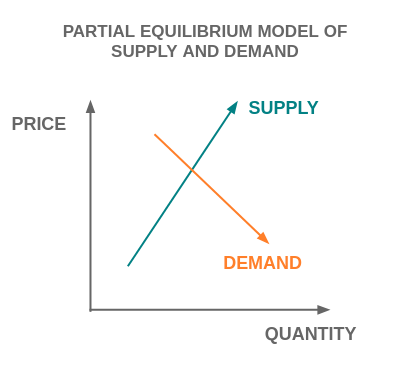
Marshall’s equilibrium model explains how the price of a good or service is determined by the intersection of supply and demand, and how price adjusts to rebalance any mismatches between the two forces. To graphically represent this mechanism, Alfred Marshall, in his Principles of Economics published in 1890, introduced demand and supply curves on a Cartesian plane, with quantity on the x-axis and price on the y-axis.

The graph above shows how the demand function decreases as price increases, while the supply function increases as price rises. The intersection of the two determines the market equilibrium price. A rightward shift in the demand curve, with supply unchanged, generates an increase in the equilibrium price; conversely, a rightward shift in the supply curve, with demand constant, leads to a decrease in price[1].
Applying this theoretical model to the aluminum market makes it possible to identify the long-term price through an analysis of demand and supply curves.
Analysis of Aluminum Demand
To study the dynamics of aluminum demand in the long run, it is first necessary to define how to measure it. Since it is not possible to know the quantity of aluminum operators would have wanted to purchase at each price level, the most effective method is to use actual consumption as a proxy. Global consumption is in fact a reliable indicator of real demand, as it indirectly reflects the effects of price, consumer preferences, and the availability of substitute goods.
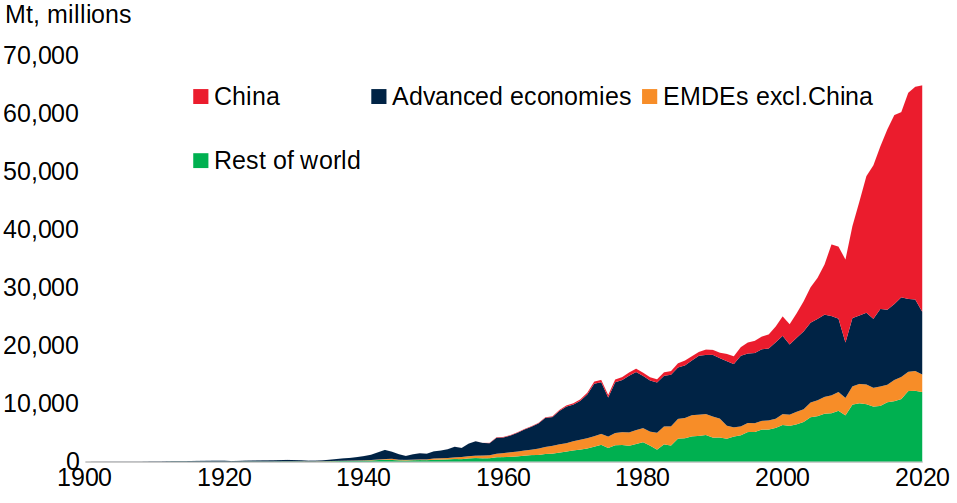
For simplicity, in this initial analysis we will focus only on global primary aluminum consumption. The following chart shows the historical series of global primary aluminum consumption from 1900 to 2020, sourced from the World Bank[2].
Historical series of global primary aluminum consumption

The chart clearly shows the exponential increase in primary aluminum consumption over the last century. While in 1920 global primary aluminum consumption was estimated at 140 thousand tons, by 2020 it had reached almost 65 million tons. The main growth in consumption came especially from China, which in just 20 years, from the early 2000s to 2020, increased its primary aluminum consumption more than 11-fold. This boom was fueled by China’s entry into the WTO in 2001, which accelerated its integration into global markets and spurred massive investments in infrastructure, construction, and manufacturing.
At the same time, the advent of “green” technologies and the processes of urbanization and industrialization supported aluminum demand also outside of China. Advanced economies expanded its use in strategic sectors such as transportation and renewable energy, while EMDEs (Emerging Market and Developing Economies) increased consumption driven by strong population growth and the rapid consolidation of their industries.
According to new data from the International Aluminium Institute (IAI), global primary aluminum demand continued to grow between 2020 and 2024, reaching about 73 million tons.
Analysts agree that this trend will continue in the long run, supported by the transport, construction, packaging, and above all renewable energy sectors.
In the European Union report VISION 2050, global primary aluminum demand in 2050 is estimated at about 110 million tons. The main growth drivers will be the spread of lightweight electric vehicles and the expansion of photovoltaics, both highly dependent on aluminum.
Do you want to stay up-to-date on commodity market trends?
Sign up for PricePedia newsletter: it's free!
Analysis of Aluminum Supply
To analyze primary aluminum supply, we will use global production as a proxy.
This represents in fact the most direct and immediate measure of the market’s supply capacity, as it reflects both investments in plants and technologies and the industrial policies adopted by the main producing countries.
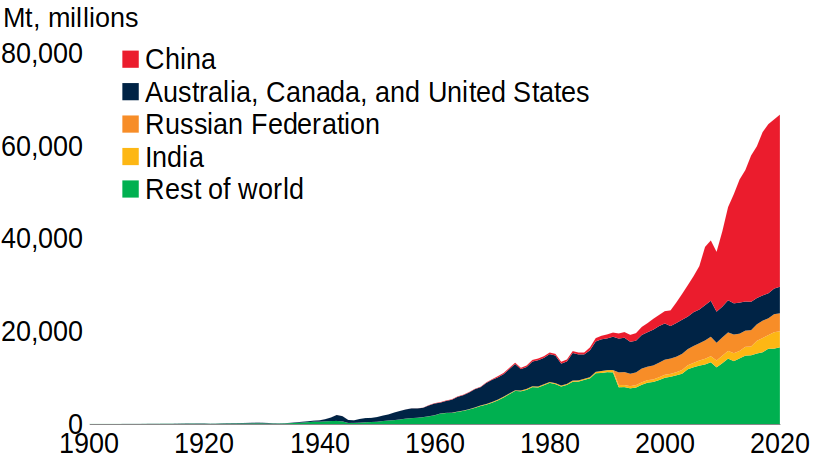
The following chart shows the historical trend of global primary aluminum production from 1900 to 2020, sourced from the World Bank[3].
Historical series of global primary aluminum production

The analysis of the chart highlights the exponential growth of primary aluminum supply, which rose from 7 thousand tons in 1900 to almost 67 million tons in 2020. Here too, the most significant increase came from China, which since the early 2000s has increased its production 14-fold. Comparing these data with the demand data reported earlier, it emerges that between 2000 and 2020 China’s aluminum supply growth significantly outpaced domestic consumption growth. This imbalance resulted in an oversupply that limited the growth of aluminum’s relative prices compared to other substitute metals such as copper and zinc.
To contain oversupply and stabilize prices, China subsequently ordered the closure of obsolete plants and introduced a maximum cap of 45 million tons per year for primary production, with the aim of simultaneously reducing emissions and market overcapacity. This measure should dampen, at least in the short term, the growth rate of supply, allowing demand to grow more rapidly again. In the long term, however, supply is also destined to increase in order to meet rising global consumption.
According to the International Aluminium Institute (IAI) report: Aluminium Sector Greenhouse Gas Pathways to 2050, primary production will continue to grow only marginally, reaching between 75 and 90 million tons by 2050.
The PricePedia Forecast Scenario
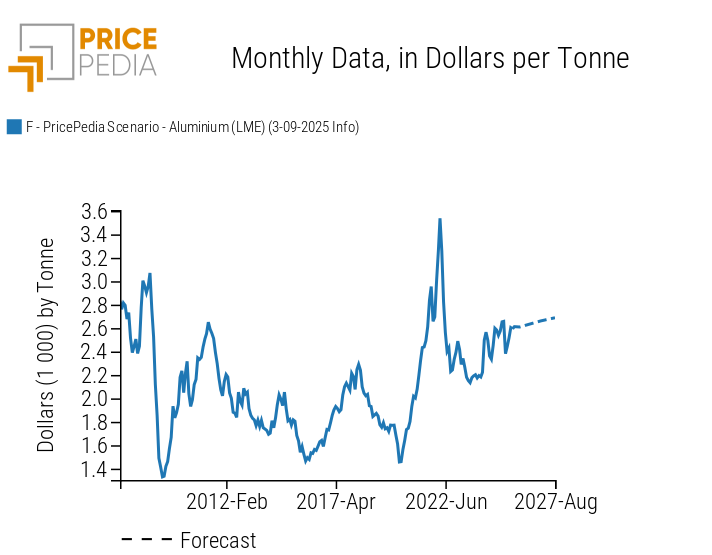
Marshall’s model is a fundamental tool for identifying price formation mechanisms; however, it is not sufficient on its own to predict price trends, as it also requires assumptions about future demand and supply. This gap is filled by the activity of financial operators who, through futures trading, determine the expected price of an underlying at a specific future date. This information is integrated into the forecast scenario developed by PricePedia, which reports LME aluminum price estimates through August 2027.
PricePedia forecast of LME aluminum prices

The PricePedia forecast scenario, with information available up to September 3, indicates an expected increase in LME aluminum financial prices, estimated at around $2,700/ton by August 2027. This trend is consistent with the analysis of fundamentals outlined earlier, particularly in light of China’s recent reduction in supply aimed at mitigating production excess.
Conclusions
The analysis of long-term fundamentals shows how the growth of aluminum demand and supply has been strongly driven by China, with exponential expansion from 1900 to the present. In the long run, global primary aluminum demand will continue to grow, supported by the transport, construction, packaging, and renewable energy sectors, reaching about 110 million tons by 2050.
On the supply side, in the short term Chinese primary production remains constrained by the maximum cap of 45 million tons per year imposed by Beijing. In the long term, however, this limit may be progressively exceeded: according to the International Aluminium Institute, primary aluminum supply in 2050 is expected to be between 75 and 90 million tons.
Faced with a slowdown in Chinese supply and an increase in global demand, driven by the development of lightweight electric vehicles and the expansion of photovoltaics, Marshall’s equilibrium model suggests a long-term increase in aluminum prices.
This dynamic is already reflected in the forecast scenario developed by PricePedia, which for August 2027 estimates growth in LME aluminum financial prices to around $2,700/ton.
For a more in-depth analysis of Marshall’s equilibrium, see the article: The Microeconomic Approach to the Analysis of Commodity Markets: The Law of Supply and Demand.
[2] Data on global primary aluminum consumption are available on page 74 of the book by John Baffes and Peter Nagle: Commodity Markets: Evolution, Challenges, and Policies, available on the official World Bank website.
[3] Data on global primary aluminum production are available on page 63 of the book by John Baffes and Peter Nagle: Commodity Markets: Evolution, Challenges, and Policies, available on the official World Bank website.


