Fears of supply shortages drive up copper prices
Growing tensions on energy and metals markets
Published by Luca Sazzini. .
Conjunctural Indicators Commodities Financial WeekThis week, commodity financial markets showed an overall bullish trend.
In the energy sector, crude oil and its derivatives followed an upward path driven by escalating geopolitical tensions. Statements by President Donald Trump, according to which NATO countries should firmly respond to any Russian incursions into airspace, fueled fears of a broader conflict. This was compounded by new restrictions announced by Moscow on diesel exports, motivated by damage to energy infrastructure hit by Ukrainian drones.
However, the bullish momentum eased in recent days after official data from the U.S. Department of Energy showed an unexpected increase in crude oil inventories.
On the natural gas front, attention focused mainly on weather conditions. Milder-than-expected temperatures reduced demand across all major consumption areas, leading to substantial price stability in Europe (Dutch TTF) and a contraction in regional prices in the United States (Henry Hub) and Asia (JKM).
In the metals market, ferrous metals remained broadly stable, while non-ferrous and precious metals recorded significant gains. Among non-ferrous metals, copper led the rally, surpassing $10,300/ton on the London market, with an almost 5% increase recorded in a single day. Indonesia’s Grasberg mine, the world’s second-largest, has been shut down since September 8 due to a fatal landslide; following the incident, owner Freeport-McMoRan declared force majeure, temporarily suspending contractual obligations. The mining company also cut its copper and gold sales forecasts, estimating that consolidated sales in the third quarter could be about 4% lower for copper and about 6% lower for gold compared to July estimates. Analysts warn that operations may not be fully restored until 2027, given the exceptional severity of the incident.
This supported not only copper’s rally but also that of gold, which this week reached new all-time highs, driven by uncertainty over Russia-NATO relations following recent airspace violations, which kept the risk premium high for all major precious metals. In particular, gold surpassed $3,800/troy ounce in intraday trading, while silver is nearing the historic peak of $48/troy ounce set on April 29, 2011.
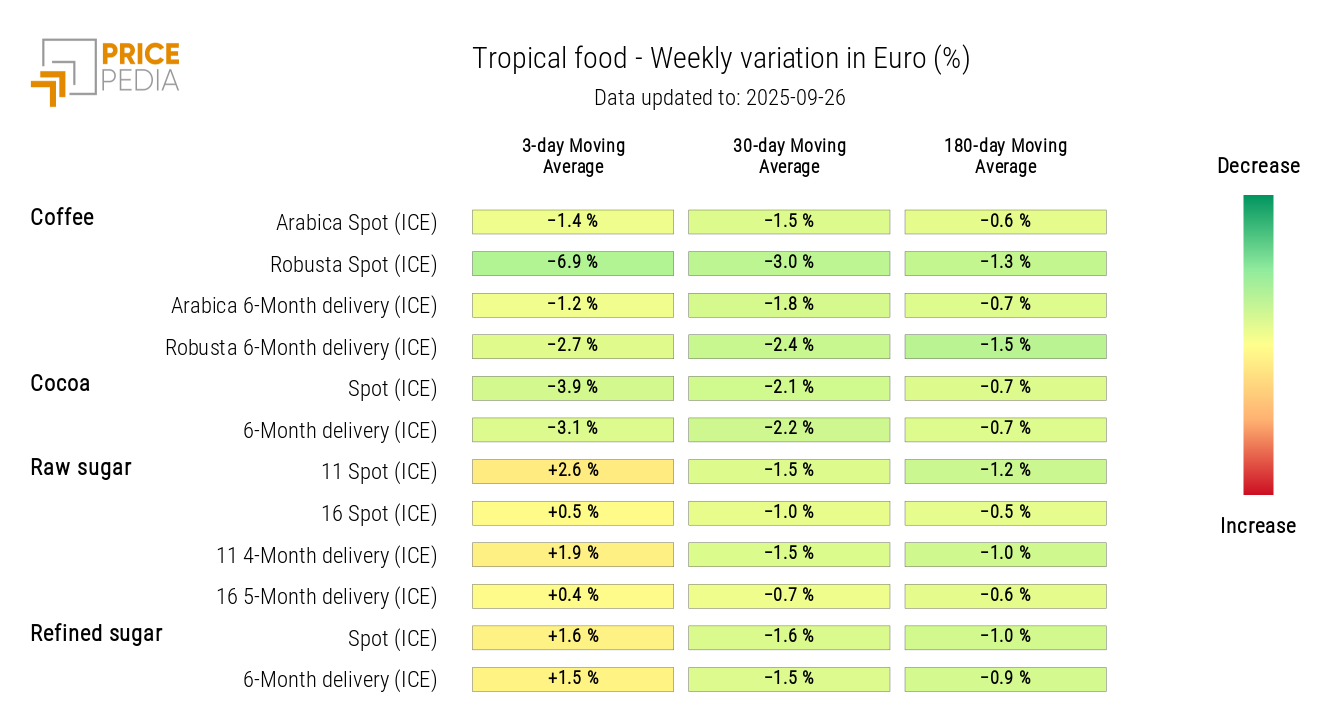
In the food sector, tropical commodities continue to follow a bearish trend, driven by rainfall in Brazil during the critical flowering period of coffee and cocoa, while cereals and edible oils remain stable.
US PCE Inflation
In August, U.S. inflation, measured by Personal Consumption Expenditures (PCE), rose by 0.3% on a monthly basis and 2.7% on a yearly basis, in line with analysts’ expectations. The core PCE index, which excludes food and energy, remained stable at 2.9% y/y, with an increase of 0.2% m/m, also in line with forecasts.
These figures indicate that inflationary pressure in the United States remains elevated, well above the Federal Reserve’s (FED) 2% target, though without evidence of uncontrolled acceleration.
For the central bank, the current scenario keeps open the possibility of another rate cut, but risks related to persistent inflation remain high. To assess the FED’s next moves, it will also be important to monitor labor market developments and the overall strength of the U.S. economy.
NUMERICAL APPENDIX
ENERGY
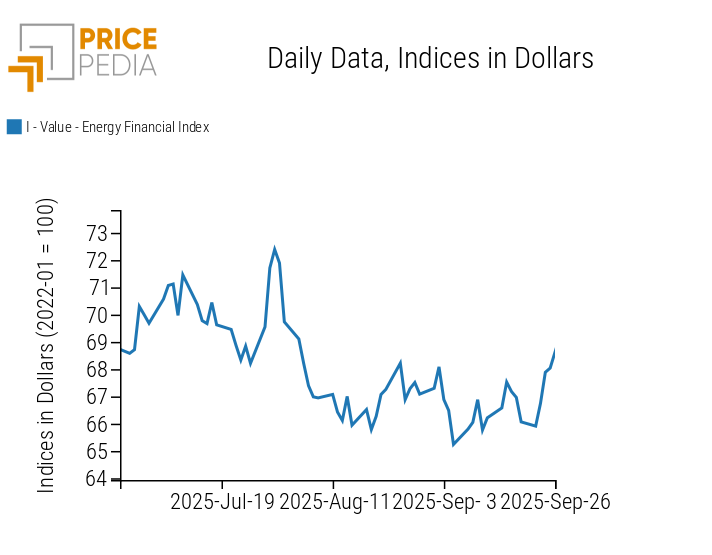
The PricePedia energy index returns above the levels lost last week.
PricePedia Financial Index of energy prices in dollars
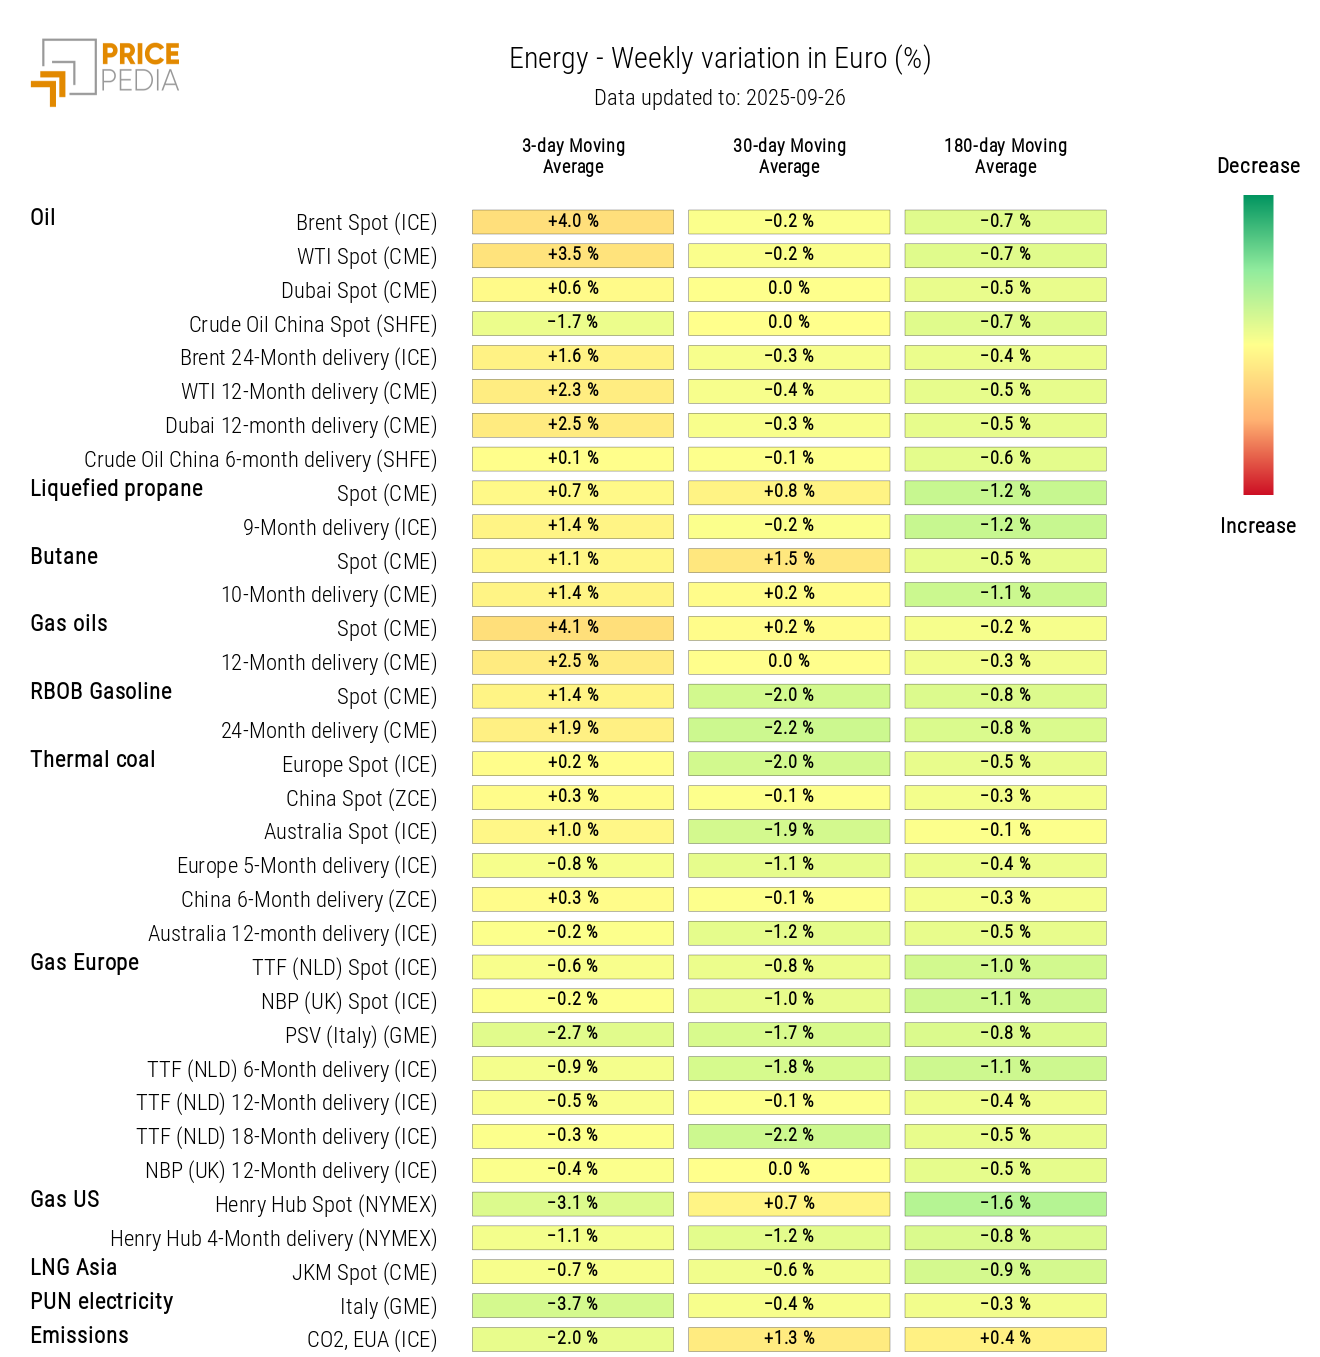
The energy heatmap highlights rising prices for oil and its derivatives (especially Diesel), against falling U.S. and Asian LNG prices.
HeatMap of energy prices in euros
PRECIOUS METALS
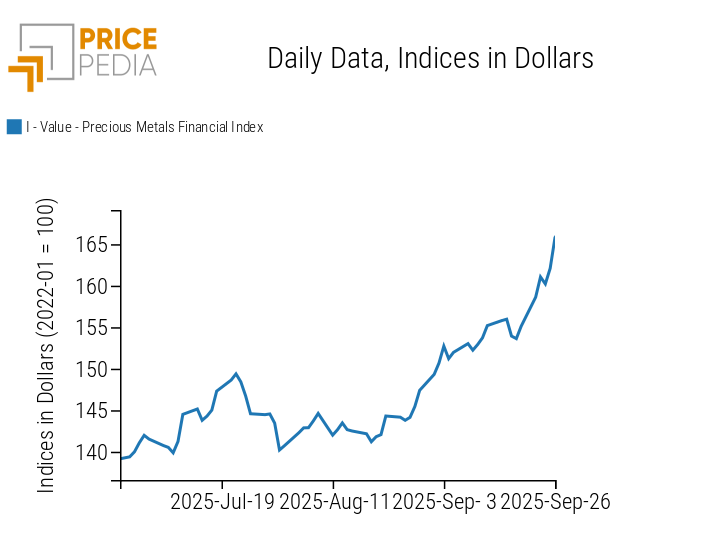
The financial index of precious metals reaches new all-time highs, fueled by ongoing tensions between Russia and NATO.
PricePedia Financial Index of precious metals prices in dollars
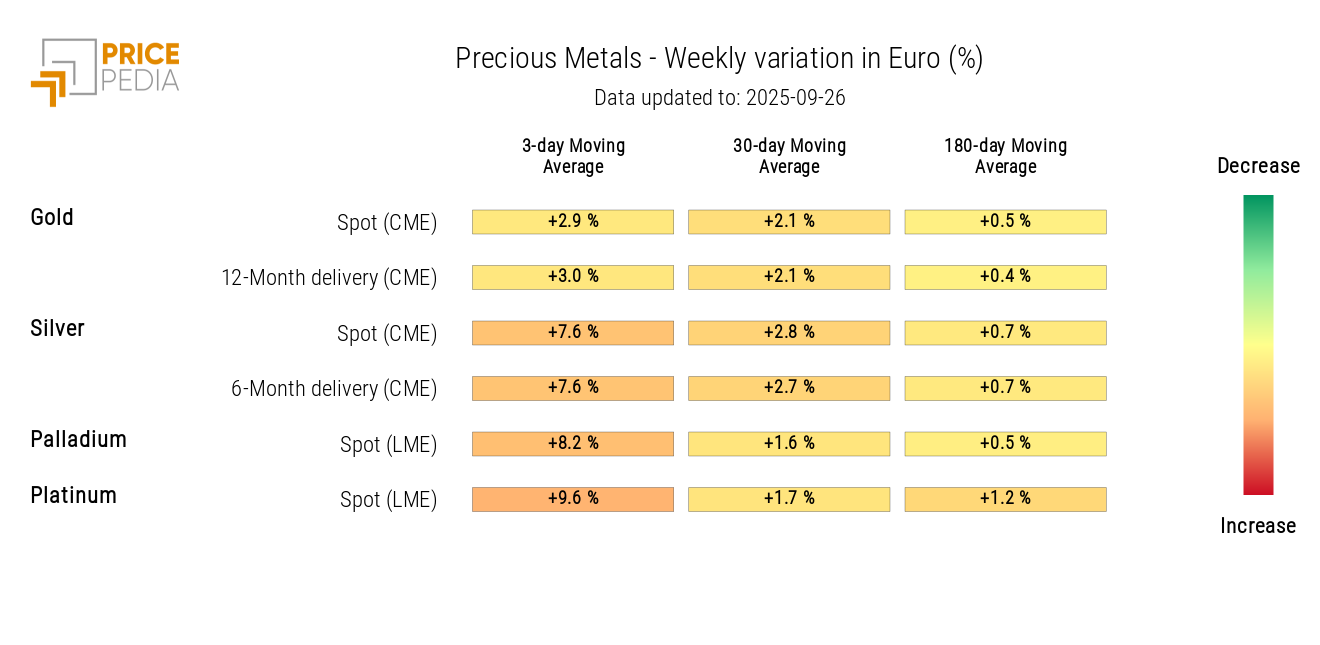
The heatmap analysis shows a broad increase in precious metals prices.
HeatMap of precious metals prices in euros
FERROUS
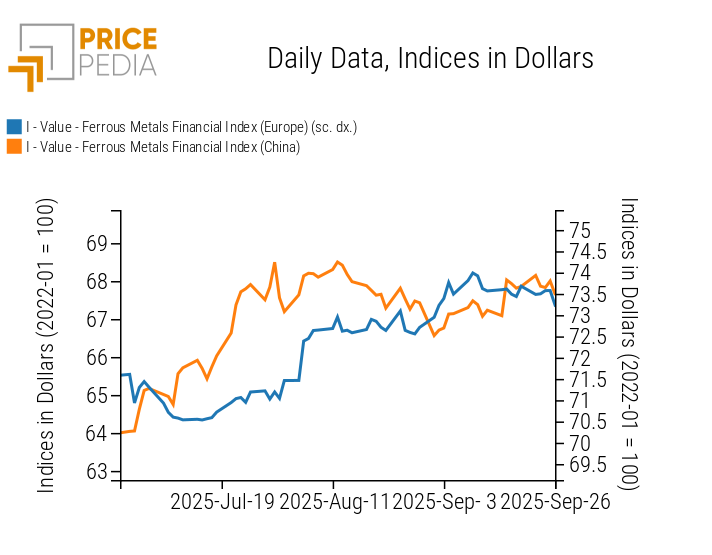
Both financial indices of ferrous metals followed a sideways trend during the week.
PricePedia Financial Indices of ferrous metals prices in dollars
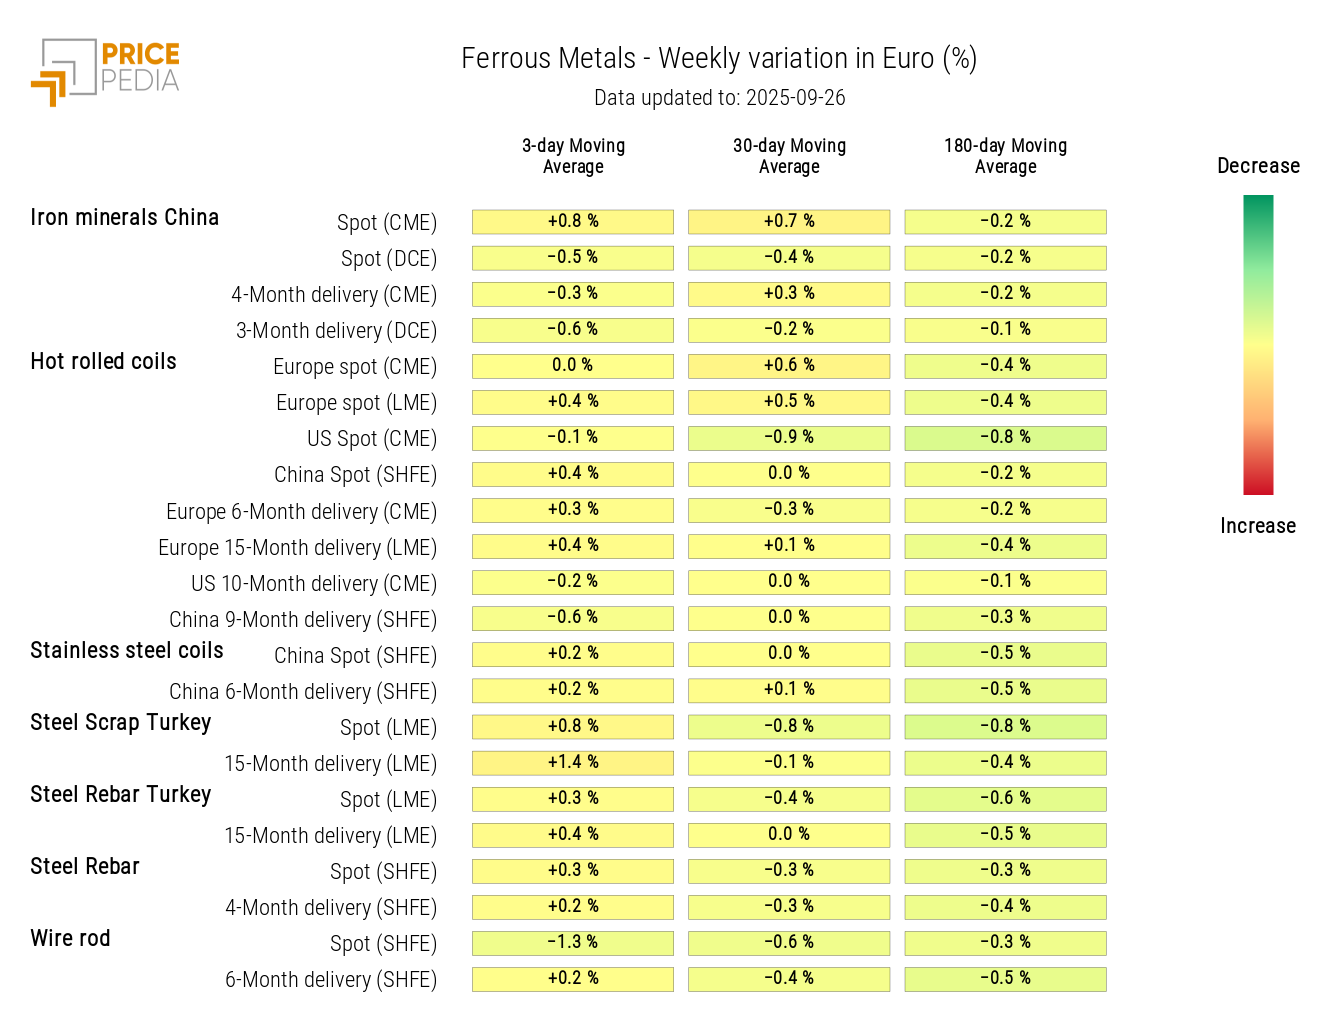
The ferrous metals heatmap shows weekly price stabilization.
HeatMap of ferrous metals prices in euros
Do you want to stay up-to-date on commodity market trends?
Sign up for PricePedia newsletter: it's free!
NON-FERROUS INDUSTRIAL
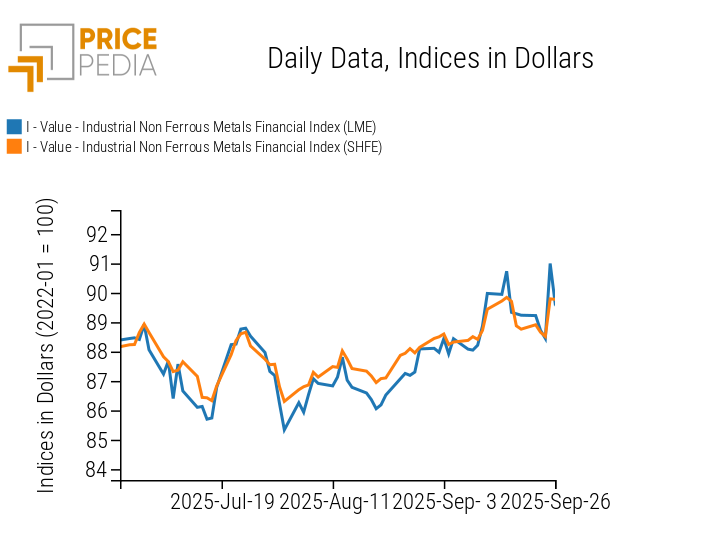
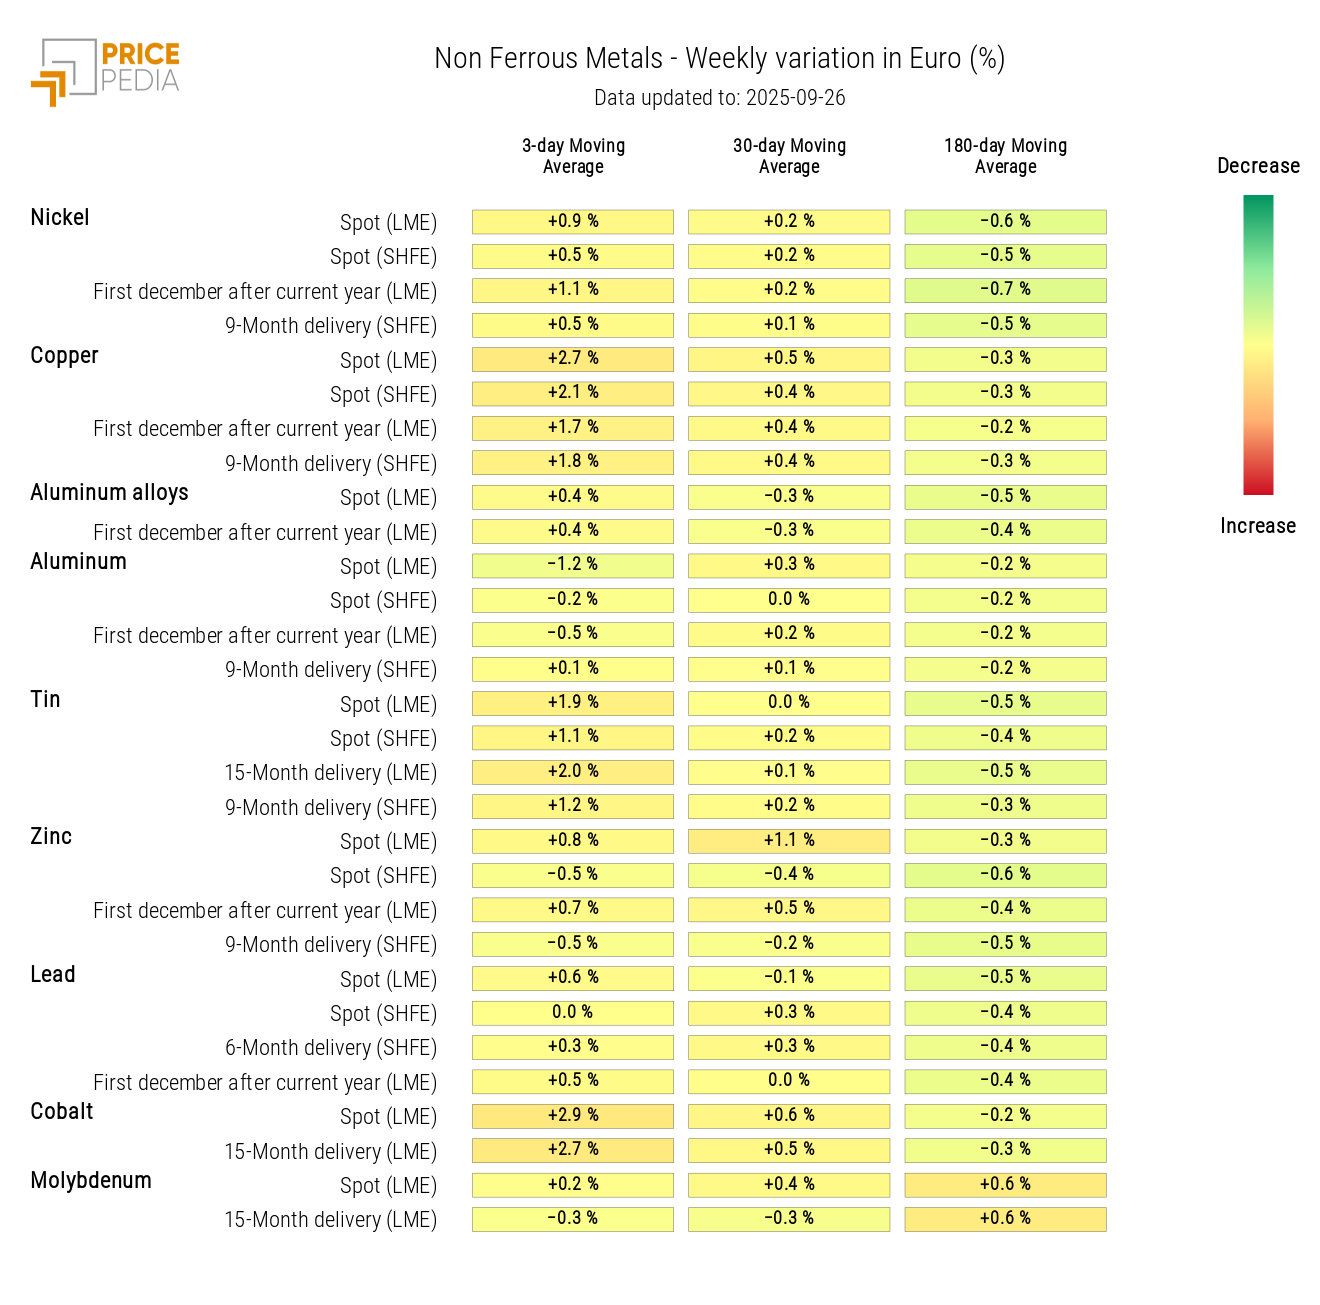
Both financial indices of non-ferrous metals show an upward shift, more pronounced in the London (LME) market index than in the Shanghai (SHFE) one.
PricePedia Financial Indices of non-ferrous industrial metals prices in dollars
The non-ferrous heatmap highlights the weekly rise in average copper prices, followed by cobalt. Last Friday’s cobalt increase is linked to the Democratic Republic of Congo’s (DRC) announcement to reduce exports in an effort to curb global oversupply.
HeatMap of non-ferrous metals prices in euros
FOOD
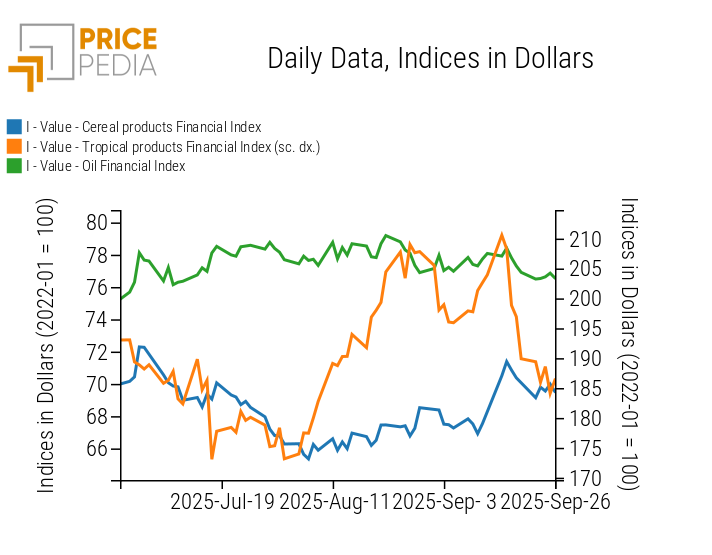
Financial indices of cereals and edible oils remain relatively stable, while tropicals continue their downward trend.
PricePedia Financial Indices of food prices in dollars
CEREALS
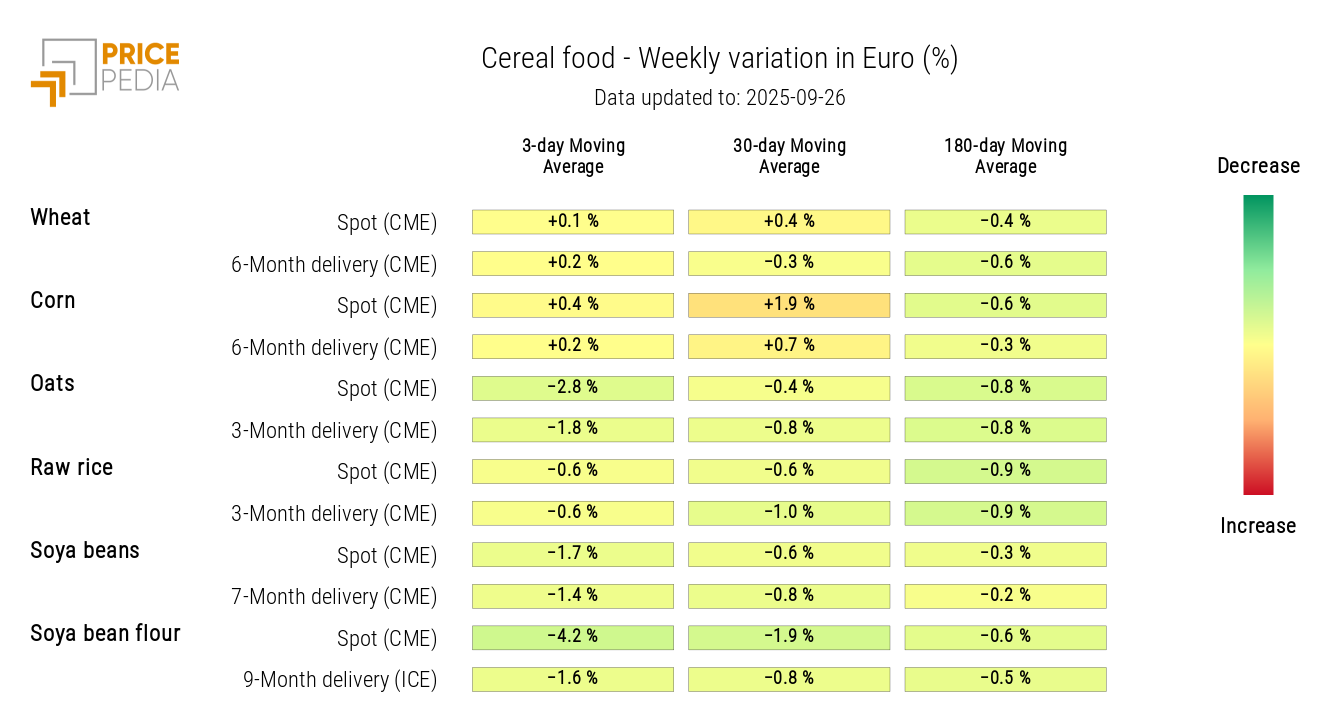
The heatmap shows a decline in soybean meal and oat prices.
HeatMap of cereal prices in euros
TROPICALS
The heatmap analysis shows a drop in coffee and cocoa prices.
HeatMap of tropical food prices in euros
