The use of relative prices to study the evolution of commodity markets
Analysis of relative prices between substitute non-ferrous metals
Published by Luca Sazzini. .
Non Ferrous Metals Analysis tools and methodologiesIn commodity price analysis, a useful support tool is represented by relative prices, i.e., the ratio between the prices of two goods. This approach is particularly effective for substitute commodities, as it allows the joint analysis of the dynamics of the two series, eliminating common macroeconomic effects such as the business cycle and inflation. This way, any divergences between price trajectories become clear, facilitating the identification of specific shocks or structural changes that have over time altered the relative attractiveness of the two products.
Analyzing relative prices can also provide valuable forecasting support, as it highlights any divergent trends between the two considered prices. Once these phases are identified, it becomes possible to outline alternative scenarios: a return of the ratio to historical values or, conversely, the emergence of a structural change destined to consolidate new relative levels.
This article presents three distinct analyses of the relative prices of some non-ferrous metals that can be considered substitutes. In particular, we will focus on the ratios between:
- Copper and aluminum: substitutes in electrical conductors and transportation;
- Aluminum and zinc: substitutes in anti-corrosion coatings and die casting;
- Nickel and cobalt: substitutes in electric batteries.
Case 1: Analysis of the copper-aluminum relative price
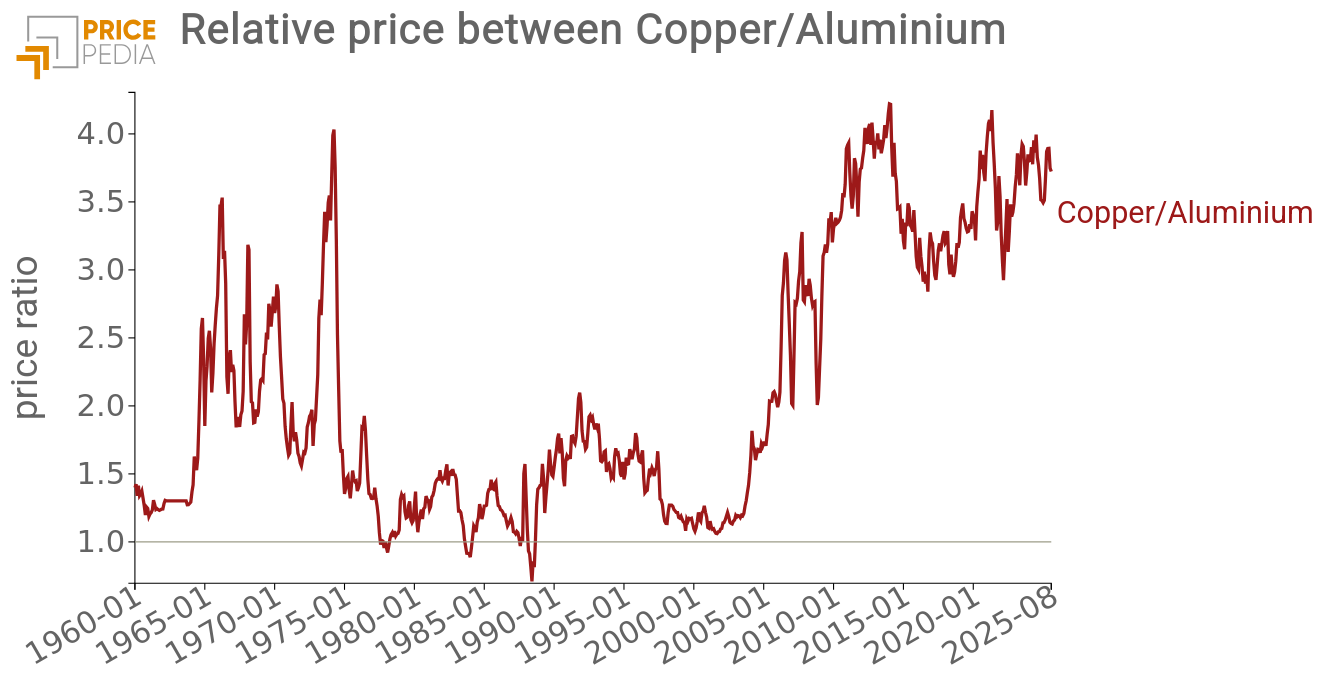
The following chart shows the relative price dynamics between copper and aluminum from January 1960 to August 2025.

The chart shows that since 1965 the ratio between copper and aluminum prices increased rapidly. The strong post-war industrial demand, combined with the development of electrical networks, pushed copper to exceed aluminum prices by more than three times. However, the real peak occurred at the beginning of 1974, coinciding with the global energy crisis, when the ratio briefly exceeded 4.
Between the late 1970s and the end of the 1980s, the trend reversed: technological advances in production made aluminum more competitive, favoring its substitution in some applications at the expense of copper. At the same time, copper suffered from an oversupply resulting from massive mining investments in the 1970s, so that in some periods aluminum prices even exceeded copper prices.
Since 2005, the dynamic between the two metals has reversed again, with copper prices rising much faster than aluminum. Urbanization and China’s rapid expansion, aided by WTO entry in 2001, along with the development of electrical networks and electrification, increased copper demand. Facing a rigid supply that is difficult to adjust quickly, copper experienced a structural upward trend, bringing the copper/aluminum ratio to historically high levels.
Case 2: Analysis of the aluminum-zinc relative price
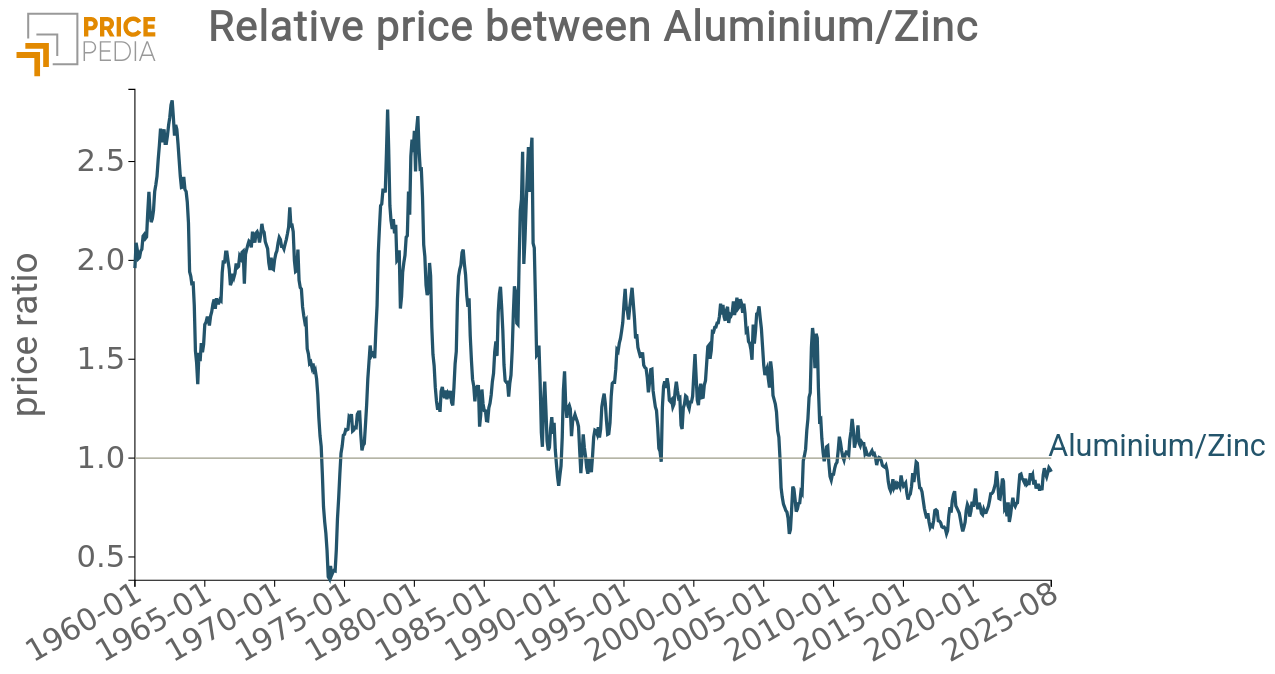
The following chart shows the historical series of the relative price between aluminum and zinc from January 1960 to August 2025.

In the 1960s, aluminum cost more than twice as much as zinc due to the high energy requirements of the electrolysis production process.
The oil crisis of the 1970s radically changed this balance: the demand for galvanized steel, combined with supply-side tensions, pushed zinc prices so high that in 1974, for a brief period, they exceeded aluminum prices. In the 1980s, the pre-energy crisis situation returned: the expansion of aluminum demand in strategic sectors such as transportation, construction, and packaging brought aluminum prices back above zinc.
In the most recent decade, the price ratio between the two metals changed again: China developed enormous low-cost aluminum production capacities, releasing volumes on the market that limited price growth. At the same time, zinc demand for galvanization increased, supporting prices and pushing them above aluminum levels.
Do you want to stay up-to-date on commodity market trends?
Sign up for PricePedia newsletter: it's free!
Case 3: Analysis of the cobalt-nickel relative price
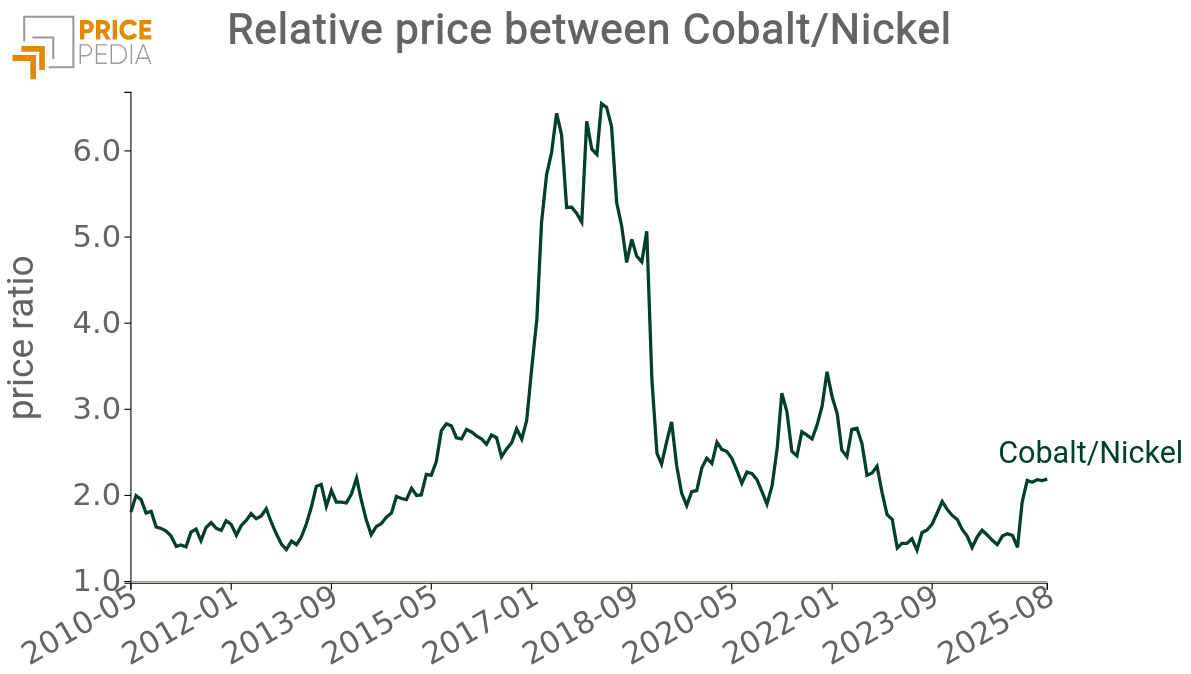
The following chart shows the relative price dynamics of cobalt and nickel from May 2010 to August 2025.

The relative price analysis shows that over the last fifteen years cobalt has generally remained at levels roughly twice those of nickel, except for the price cycle between late 2016 and early 2019. During the upward phase of that cycle, strong demand driven by the adoption of electric vehicles (EVs) pushed cobalt prices up to six times those of nickel. In the subsequent EV-driven cycle from 2021 to 2023, the price dynamics were more balanced: cobalt-nickel price ratios did not exhibit the same fluctuations as the previous period. This trend mainly reflects the development of new generations of high-nickel batteries (NMC and NCA), which reduced dependency on cobalt, making it partially substitutable with nickel.
Conclusions
The analysis of relative prices highlighted the dynamics governing price ratios among different non-ferrous metals, revealing historical phases characterized by divergent trends.
In the case of aluminum, relative prices compared to copper and zinc did not increase during the 1973 energy crisis, but rose around 1980.
More recent dynamics show that aluminum, due to high Chinese production, is currently at relatively low levels compared to its main substitutes, copper and zinc. This situation has already led China to significantly reduce aluminum supply, increasing the likelihood of a possible recovery in its relative prices.
The comparison between cobalt and nickel highlights a very different relative price dynamic in the two main EV demand cycles. During the first boom, between 2016 and 2019, cobalt prices exceeded nickel prices by more than six times, also driven by speculative movements. In the following cycle, the growing adoption of high-nickel batteries moderated the relative price increase, stabilizing the ratio between the two metals.
Overall, relative price analysis proves to be a valuable tool for understanding not only the past performance of individual metals but also the structural transformations that alter supply and demand balances within commodity markets, thus providing insights into future price prospects.


