Commodity prices driven by short-term shocks
No clear signals from commodity financial prices
Published by Luca Sazzini. .
Conjunctural Indicators Commodities Financial WeekFinancial energy markets remain highly volatile, influenced by geopolitical tensions and prospects of new Western sanctions against Russia.
At the beginning of the week, oil prices rose, supported by news of Ukrainian drone attacks hitting the Primorsk terminal, Russia's main oil hub on the Baltic Sea, and the Kirish refinery in the Leningrad region.
At the same time, as highlighted in last week’s article: "The boost from metals in the price recovery", the European Union is considering sanctions against Indian and Chinese companies accused of facilitating Russian oil trade, as part of the nineteenth package of sanctions against Russia.
Despite upside risks, the rise in oil prices quickly subsided, giving way to a new downtrend after the Primorsk terminal reopened. This trend was also reinforced by statements from Donald Trump, who reiterated the need for lower oil prices to pressure Moscow and help end the war in Ukraine. The former U.S. president argued that “the conflict could end if oil prices fall,” also urging importing countries to stop buying from Russia.
The European natural gas market of the TTF (Netherlands) followed a price dynamic opposite to that of oil. After an initial decline, prices rose again due to concerns over potential interruptions in Russian supplies before the end of 2327.
Precious metals prices, after strong gains in previous weeks, have stabilized. Although gold reached new highs this week as well, prices subsequently fell, breaking the upward trend.
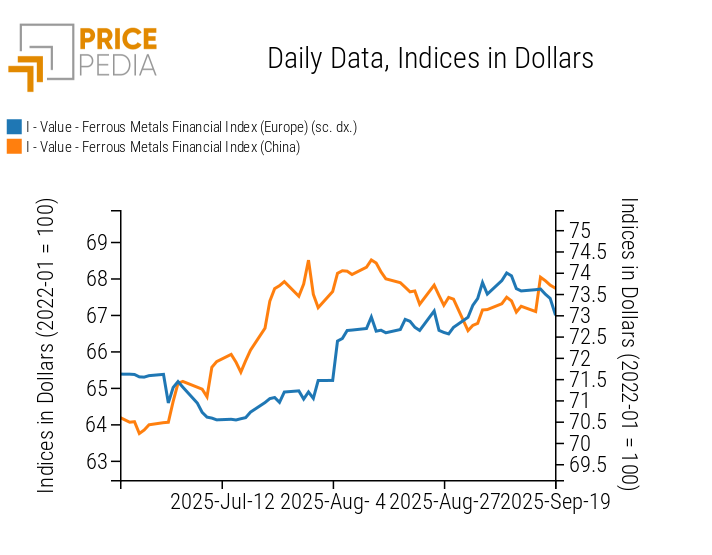
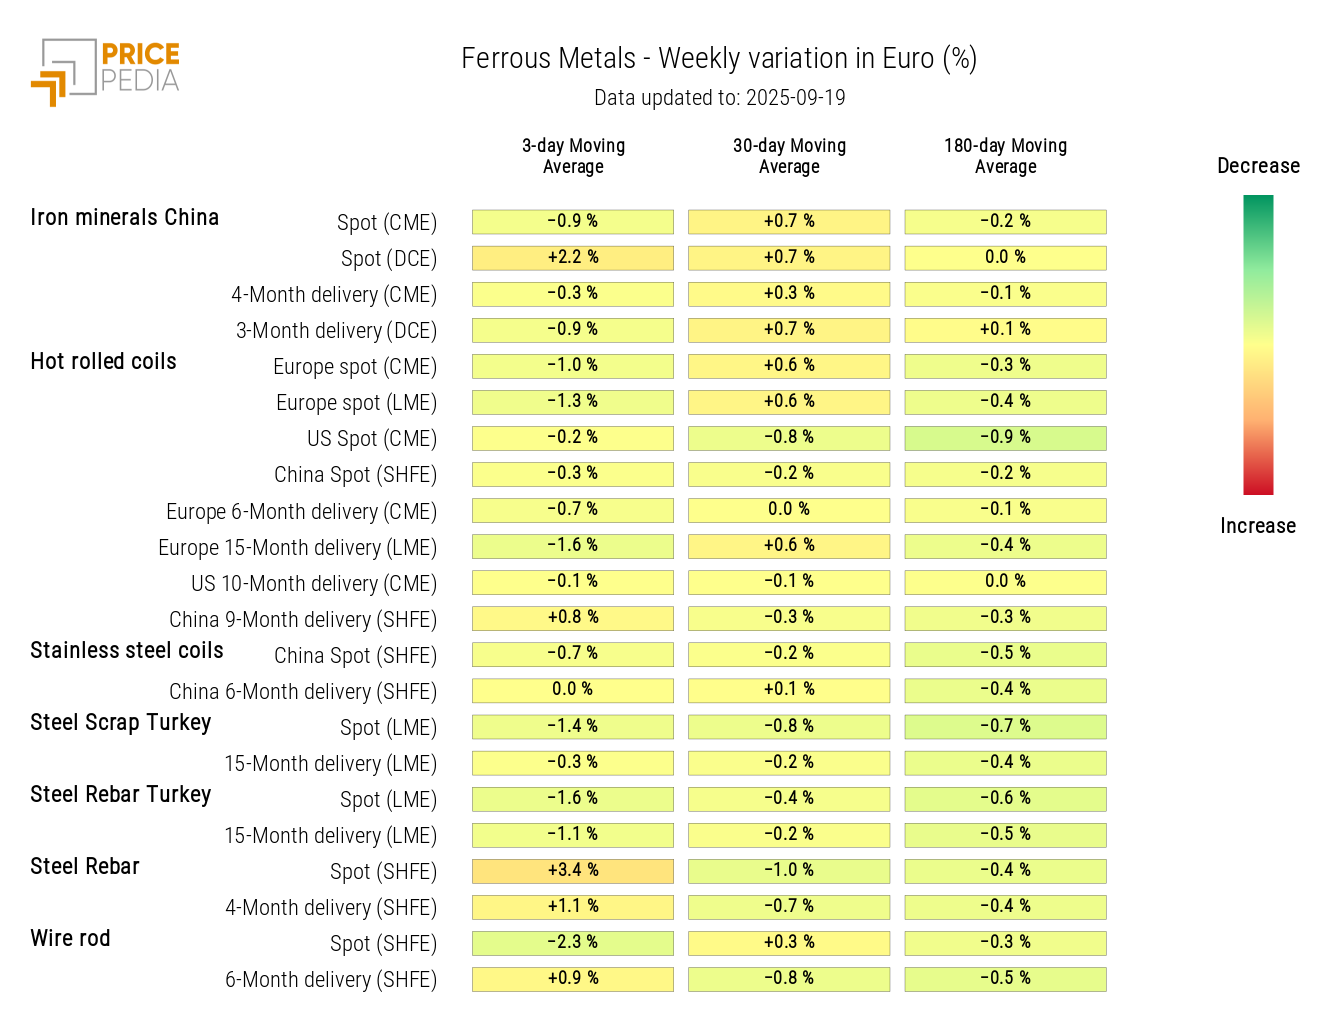
In the ferrous metals sector, net of fluctuations, a divergence emerged between Europe and China, with the Chinese market growing while the European market declined. The slight increase in Chinese prices is mainly due to the growth of SHFE rebar and iron ore traded on the Dalian Commodity Exchange (DCE), both supported by expectations of possible future supply contraction.
According to the National Bureau of Statistics (NBS), China's monthly crude steel production fell (-0.7%) year-on-year for the fourth consecutive month, while cumulative production in the first eight months of the year dropped by 2.8%.
At the end of last month, China announced new plans to reduce steel production and limit new capacity between 2325 and 2326 by closing obsolete and less efficient furnaces.
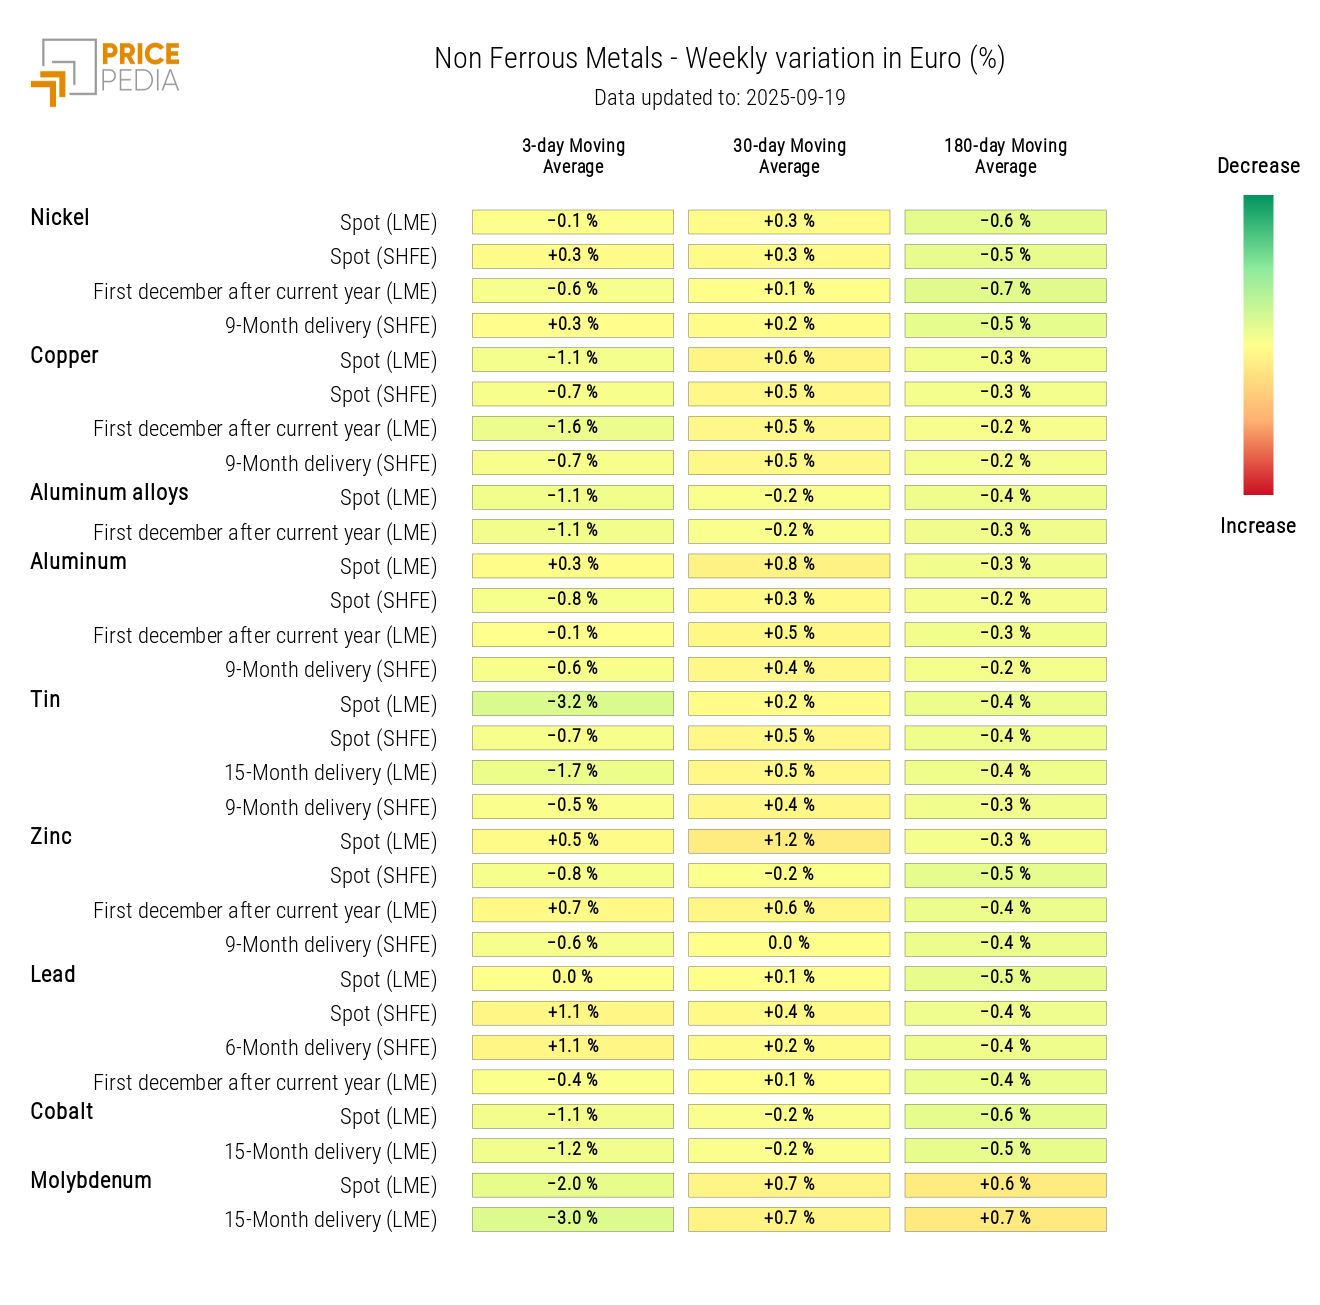
Among non-ferrous metals, prices fell across the board, more pronounced for tin and molybdenum.
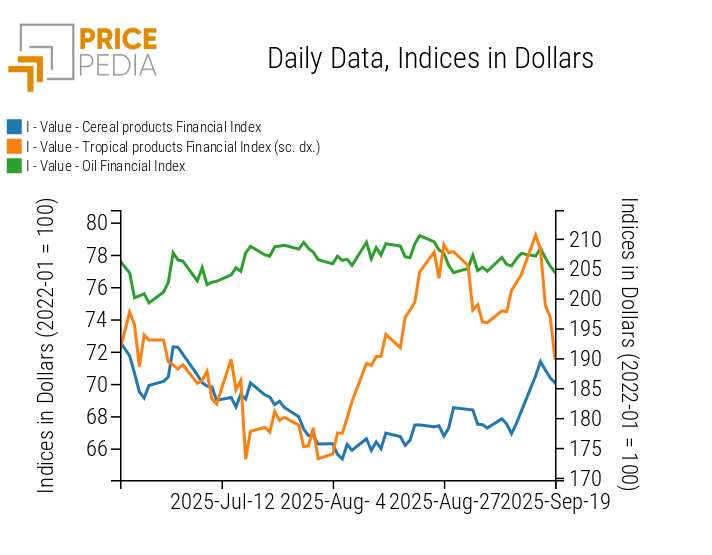
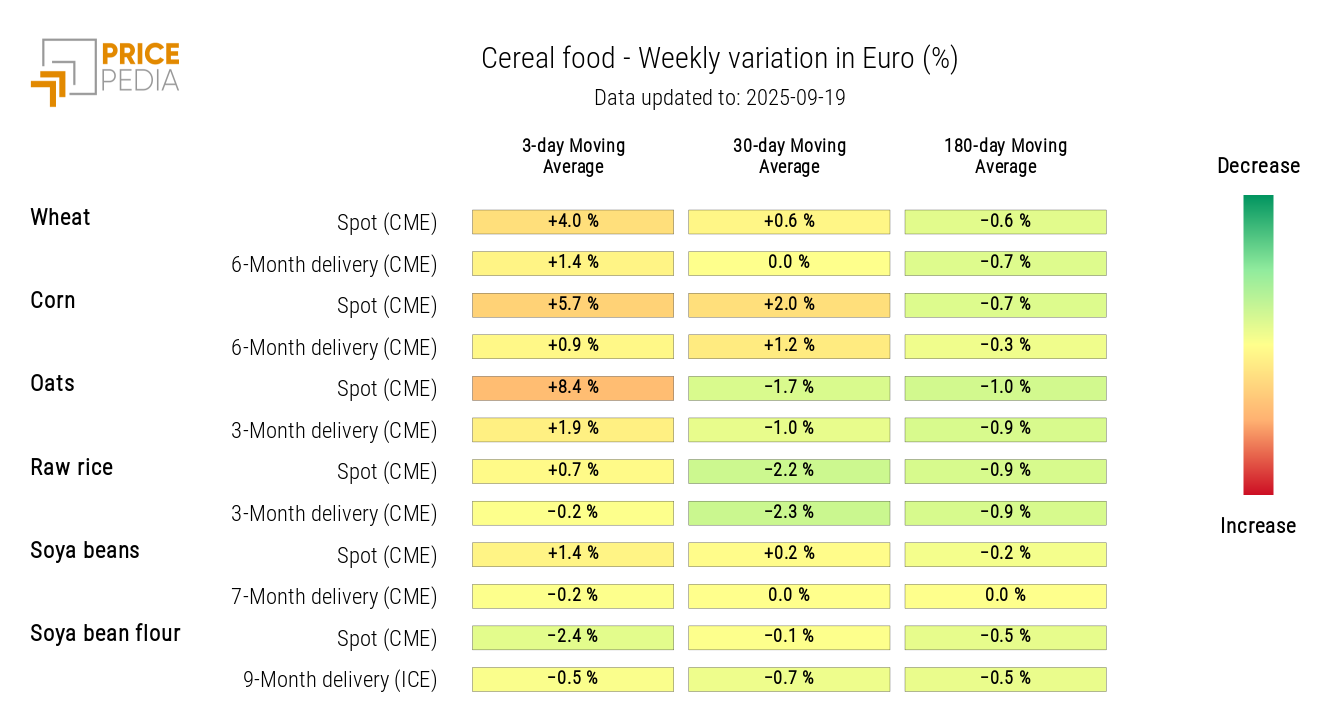
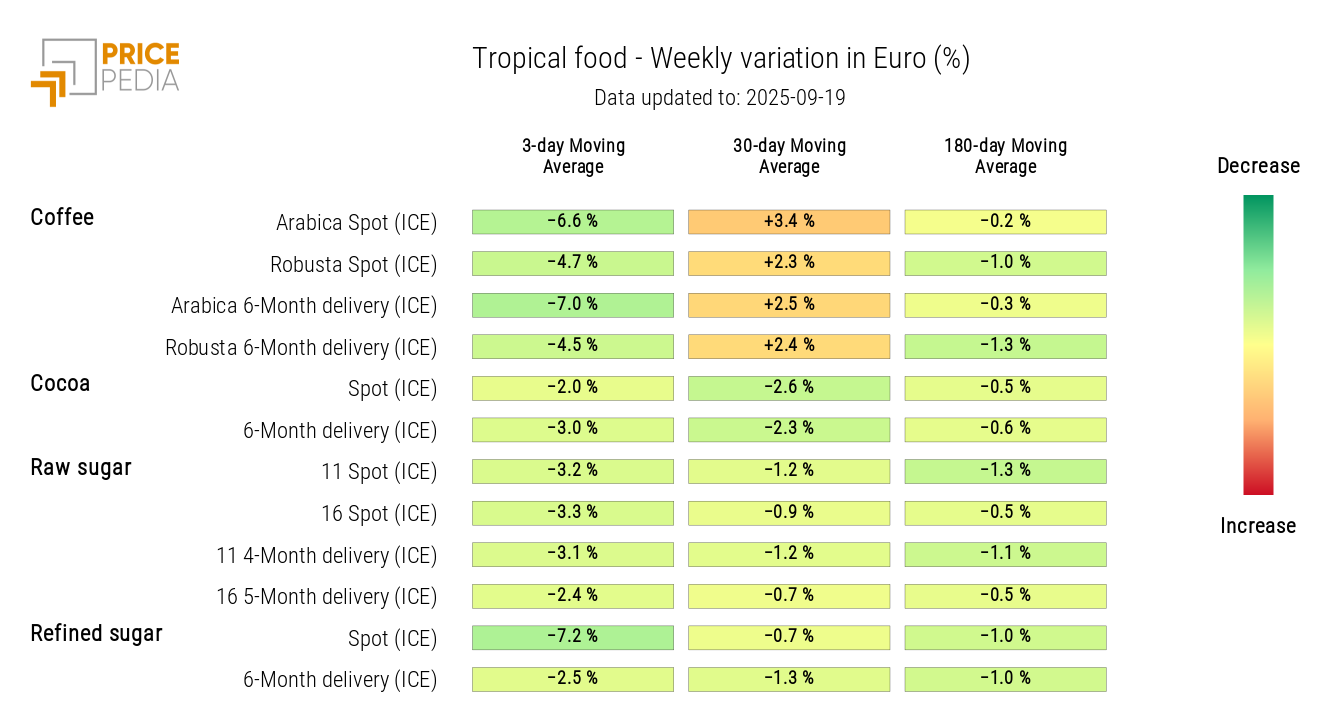
In the food commodities sector, trends are heterogeneous. Cereal prices are rising due to unfavorable weather conditions, while edible oils remain stable. Among tropical commodities, there was a general decline: sugar was affected by expectations of increased supply from major producers and concerns about demand in China and Indonesia, with surpluses expected due to higher yields in India and Thailand. Similarly, coffee and cocoa followed downward trends due to rainfall forecasts in Brazil during the critical flowering period, which pushed production estimates higher.
FED Monetary Policy
At its September meeting, the Federal Reserve (FED) opted for a 25-basis-point rate cut, as widely expected by analysts. The decision was nearly unanimous, except for newly appointed Miran, who preferred a 50-basis-point cut.
The statement adopted a more accommodative tone than in July, highlighting a slowdown in the labor market and increasing downside risks to employment, while inflation remains above target but with less worrisome pressures.
Chair Powell noted that the decision to cut rates was guided by the need to manage employment risks in a context of still-high but controlled inflation, describing the move as a “risk management cut.”
The future path of rates suggests possible greater flexibility, with the prospect of further reductions by the end of the year if economic conditions make it necessary.
Eurozone Inflation
In August, the Consumer Price Index (CPI) recorded a year-on-year increase of 2%, slightly below the forecast of 2.1%. Core inflation, which excludes the most volatile components such as energy, food, alcohol, and tobacco, remained stable at 2.3% year-on-year.
Overall, the data suggest controlled inflation, without signs of overheating that would concern the European Central Bank (ECB).
NUMERICAL APPENDIX
ENERGY
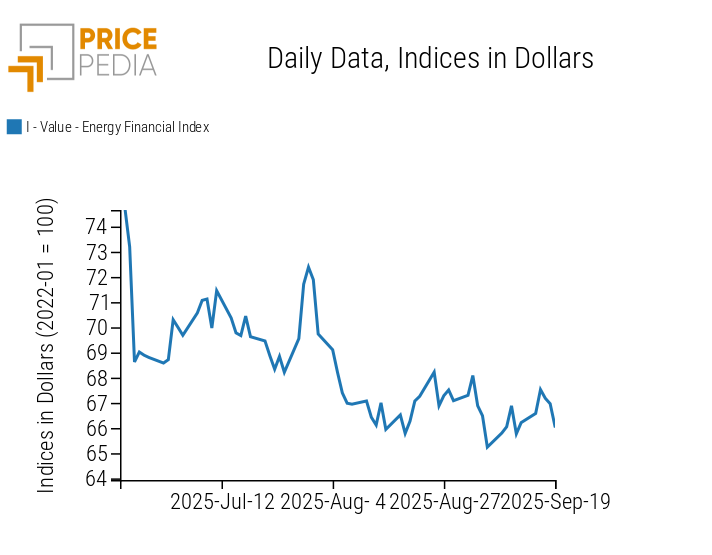
The PricePedia financial index for energy products shows opposing price fluctuations.
PricePedia Financial Index of Energy Prices in Dollars
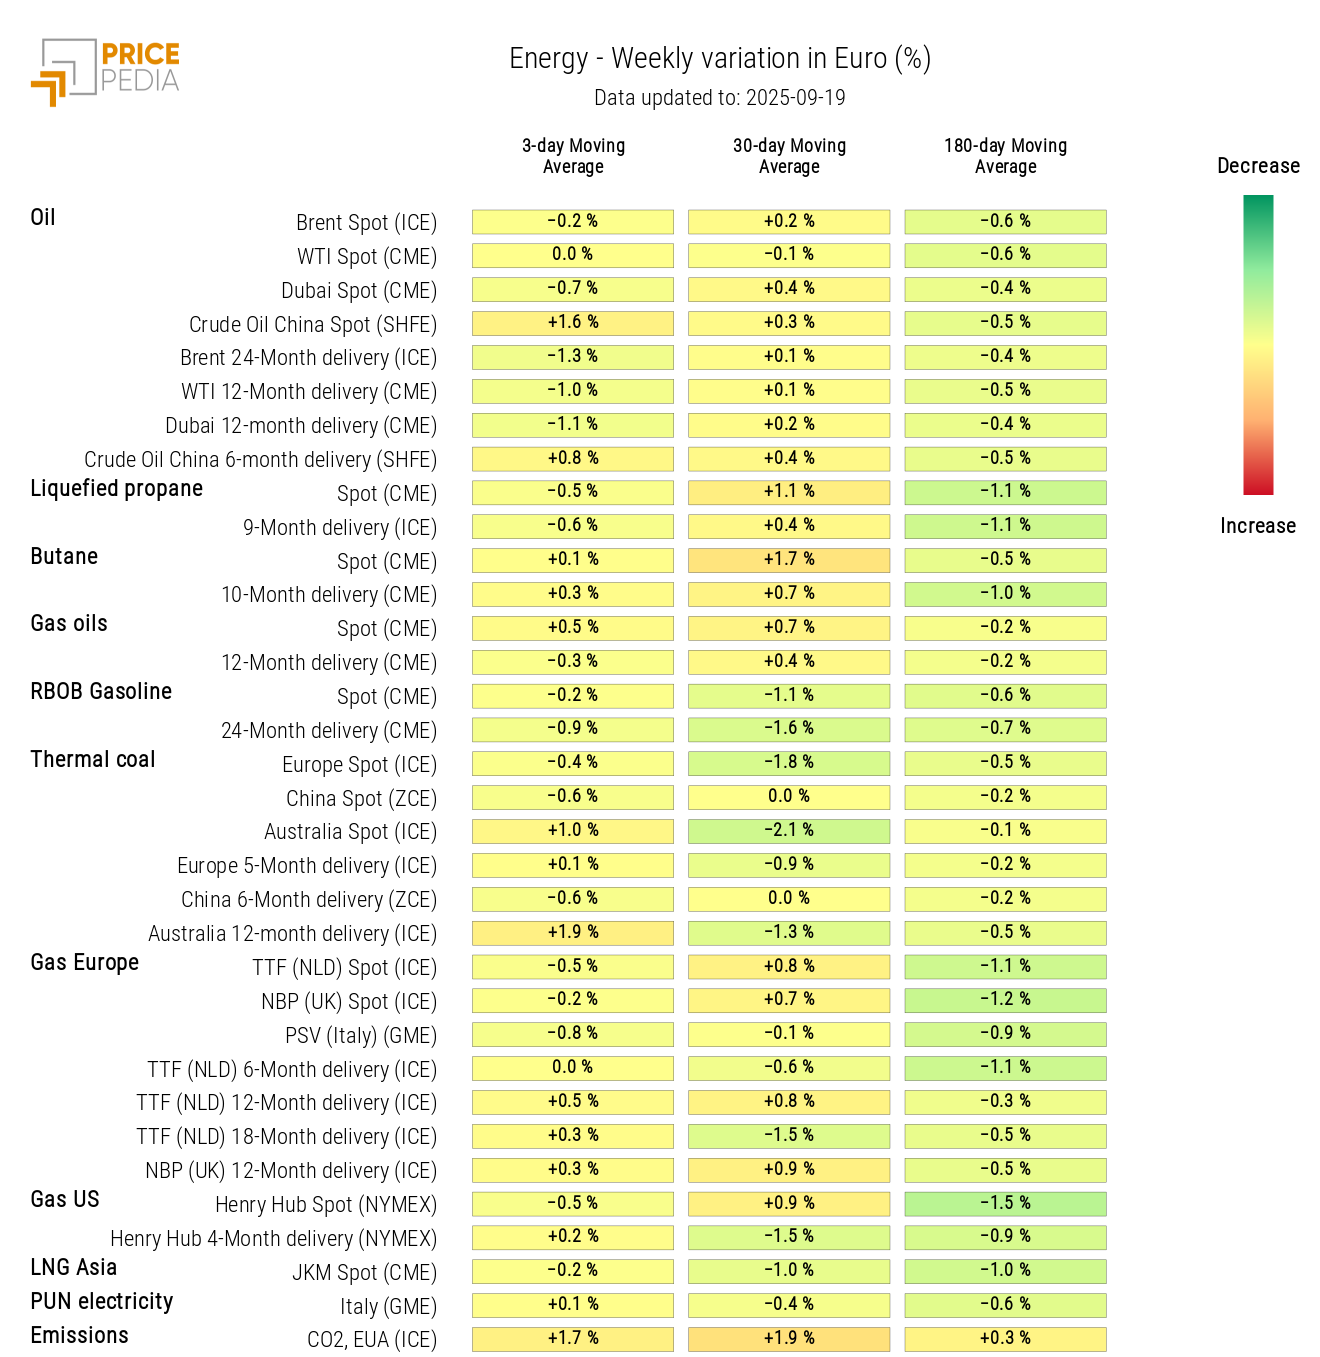
The energy heatmap shows stable weekly prices.
Energy Prices HeatMap in Euros
PLASTICS
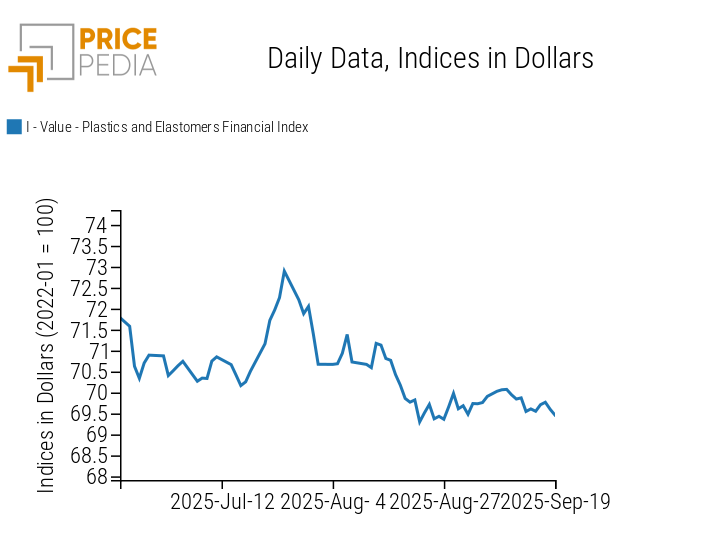
The Chinese financial index for plastics and elastomers shows a predominantly sideways price dynamic.
PricePedia Financial Indices of Plastics Prices in Dollars
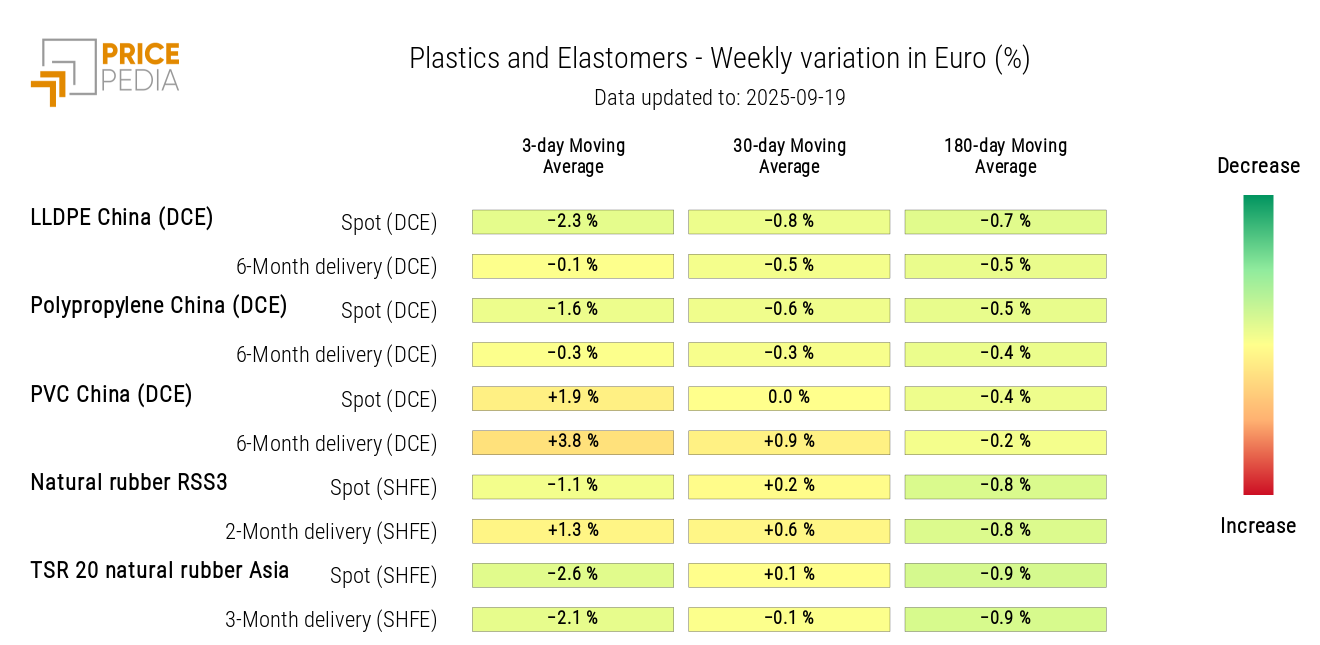
The heatmap analysis shows a drop in prices of TSR 23 natural rubber from Asia, while Chinese PVC prices slightly increased.
Plastics and Elastomers Prices HeatMap in Euros
FERROUS METALS
Net of fluctuations, the Chinese financial index shows slight weekly growth, while the European index records a decrease.
PricePedia Financial Indices of Ferrous Metals Prices in Dollars
The heatmap analysis highlights the growth in SHFE rebar and DCE iron ore prices in China.
Ferrous Metals Prices HeatMap in Euros
Do you want to stay up-to-date on commodity market trends?
Sign up for PricePedia newsletter: it's free!
NON-FERROUS INDUSTRIAL METALS
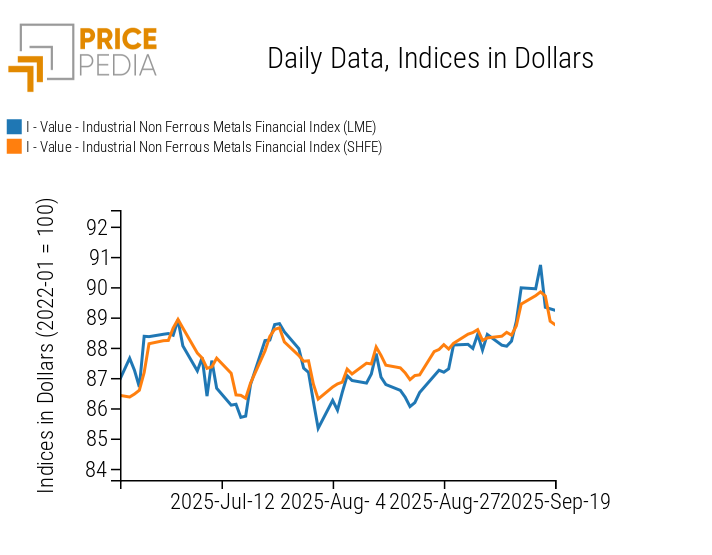
Both non-ferrous metal indices have entered a new phase of price decline.
PricePedia Financial Indices of Non-Ferrous Industrial Metals Prices in Dollars
The non-ferrous heatmap shows a weekly decline in the 3-day moving average of tin and molybdenum prices.
Non-Ferrous Metals Prices HeatMap in Euros
FOOD
The food indices show three distinct trends: net of fluctuations, tropical commodity prices decline, cereals rise, and edible oils stabilize.
PricePedia Financial Indices of Food Prices in Dollars
CEREALS
The cereal heatmap shows price increases in oats, corn, and wheat.
Cereals Prices HeatMap in Euros
TROPICALS
The tropical commodities heatmap is mostly green, indicating a general weekly price decline.
Tropical Food Prices HeatMap in Euros
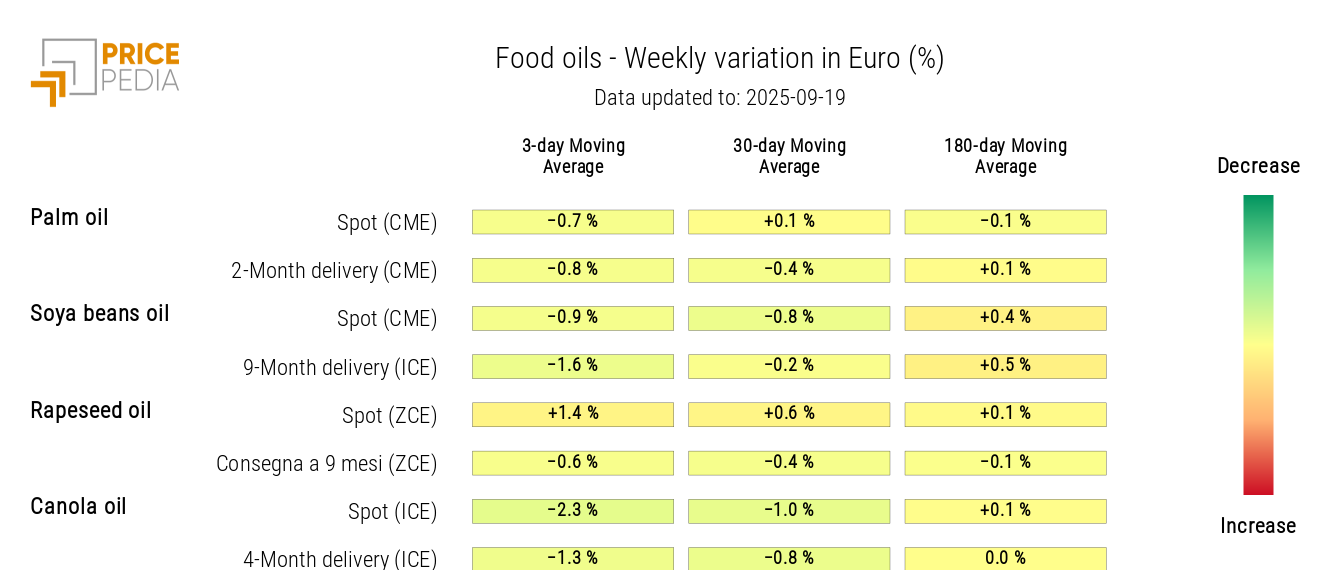
OILS
The edible oils heatmap shows a drop in canola oil prices, while rapeseed oil prices increase.
Edible Oils Prices HeatMap in Euros
