The boost from metals in the price recovery
Geopolitical tensions weigh primarily on energy
Published by Luca Sazzini. .
Conjunctural Indicators Commodities Financial WeekThe European Union is beginning to prepare the nineteenth package of sanctions against Russia, with the aim of reducing revenues that finance the conflict in Ukraine and closing loopholes in existing restrictions. Among the main measures will likely be stricter restrictions for Russian banks and energy companies, as well as reinforced sanctions against foreign companies that support the so-called Russian “shadow fleet” or purchase Russian oil to resell it in Europe by circumventing sanctions.
The announcement of further energy sanctions by Europe initially supported a partial recovery of energy prices, following last week’s decline.
The rise in oil prices was also supported by OPEC’s announcement, at the meeting held on Sunday, September 7, of an increase in production below market expectations, set to start in October. The upward movement then intensified following the Israeli attack on Doha, the capital of Qatar, which fueled geopolitical tensions in the Middle East, increasing fears of possible supply disruptions and prompting operators to step up oil purchases. However, the outlook for the oil market remains characterized by significant future surpluses, as confirmed by the latest forecasts from the IEA (International Energy Agency), which foresee for 2026 a slowdown in Chinese oil demand and an increase in global supply.
In the industrial metals sector, the prices of both ferrous metals and non-ferrous metals showed an upward phase, which began in the last days of the week. This increase is largely attributable to recent trade data on metals in China, indicating a recovery in demand.
The most significant increase concerns aluminum, supported by a sudden drop in physical inventories. In particular, Malaysian holders of LME warrants exercised their right to withdraw the metal, reducing immediate availability and fueling price pressure.
As often happens, zinc prices followed the same trend as aluminum.
Copper, however, remains the non-ferrous metal with the strongest gains over the past month, pushing its LME price back above the threshold of 10,000 dollars per ton.
Another base metal to keep under observation is nickel, which on Friday 12 recorded a sudden increase, reversing its recent trend. The Indonesian task force seized part of a major mine owned by the Chinese group Tsingshan Holding Group for permit violations. The commitment of the Indonesian president to crack down on illegal mining could further disrupt mineral flows to processing countries in the coming months. This scenario would squeeze nickel supply and support a rebound in prices, despite weak demand due to the slowdown in the electric vehicle battery sector.
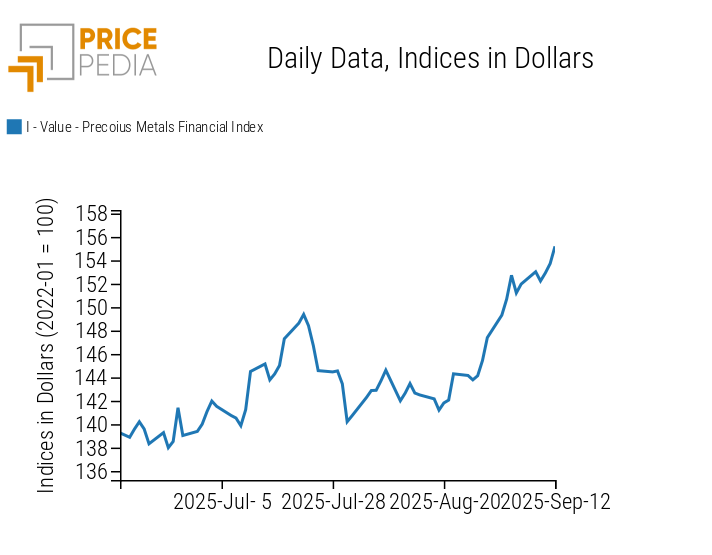
Precious metals continued their upward run, with gold surpassing the threshold of 3,600 dollars per troy ounce.
The Chinese central bank expanded its gold reserves for the twelfth consecutive month in August, bringing them above 74 million ounces (2,300 tons), in a context of strong geopolitical uncertainty.
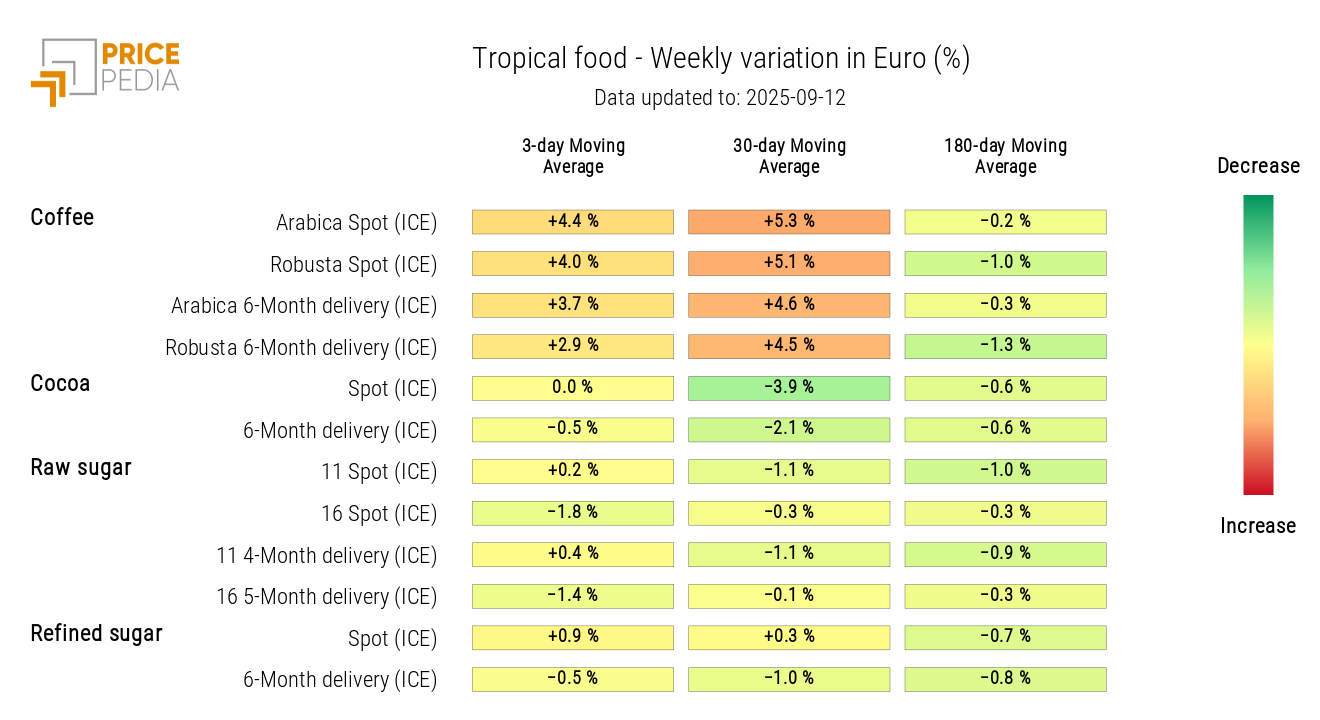
In the food commodities market, tropical products recovered, supported in particular by the rebound in coffee prices. Cereals and oils, on the other hand, showed mixed trends, remaining overall at similar levels to the previous week.
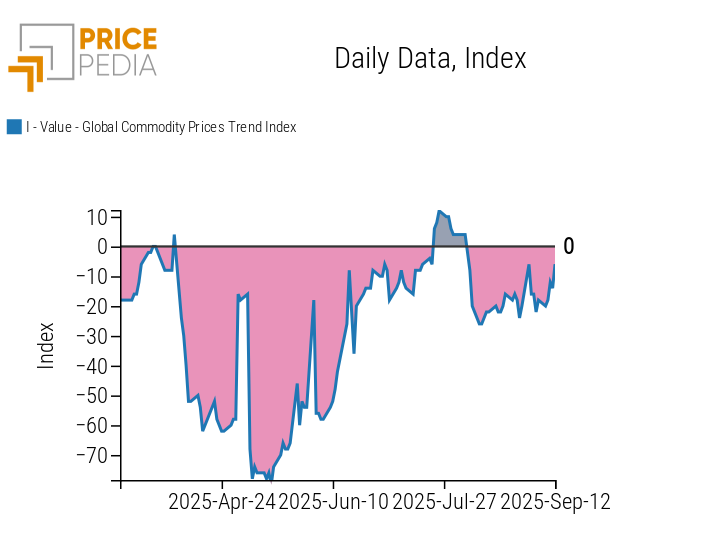
Overall, the Global Index composed of commodity financial price trends returned to neutral territory after having recorded negative values in the last month.
Global Commodity Trend Index
ECB Monetary Policy
At the meeting on September 11, the European Central Bank (ECB) kept interest rates unchanged, in line with analysts’ expectations.
Despite the new tariffs imposed by the United States, the euro area economy has proven more resilient than expected and, for the time being, there are no compelling reasons for an immediate rate cut.
Many members of the Governing Council consider it appropriate to maintain the deposit rate at 2%, while waiting to assess whether more accommodative financial conditions, the recovery of real incomes, and fiscal stimulus in Germany will be able to balance the negative effects of American protectionist measures and global uncertainty. In addition, part of the monetary stimulus has yet to be transmitted to the economy and financing conditions already appear neutral or slightly expansionary.
US Inflation
In August, US inflation, measured by the Consumer Price Index (CPI), came in above expectations, registering an increase of 0.4% m/m.
On a yearly basis, inflation rose from 2.7% to 2.9%, the highest level since January.
The main contributors to the rise came from transportation, with a 5.9% increase in airfares, and housing, up 3.6% year-on-year.
Despite these data, a 25 basis point interest rate cut is still expected from the Federal Reserve (FED) at the meeting next week.
Labor market data, in fact, show signs of weakness, with weekly jobless claims rising to 263,000, the highest level since 2021.
NUMERICAL APPENDIX
ENERGY
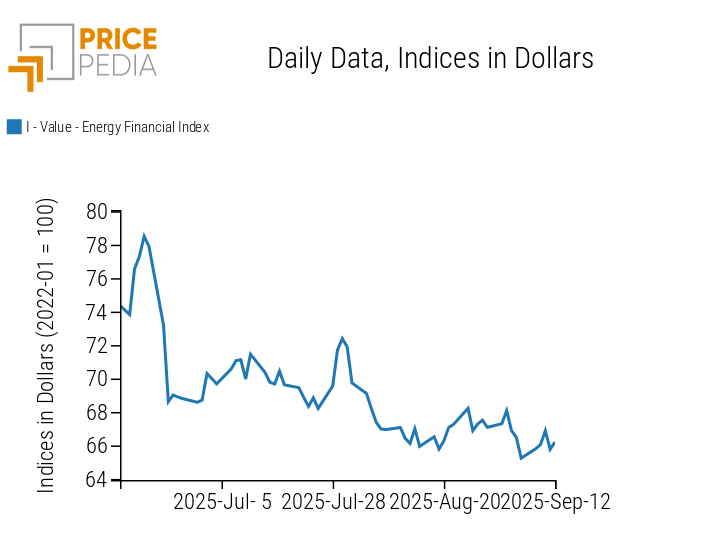
The PricePedia energy index recovers part of last week’s price decline.
PricePedia Financial Index of energy prices in dollars
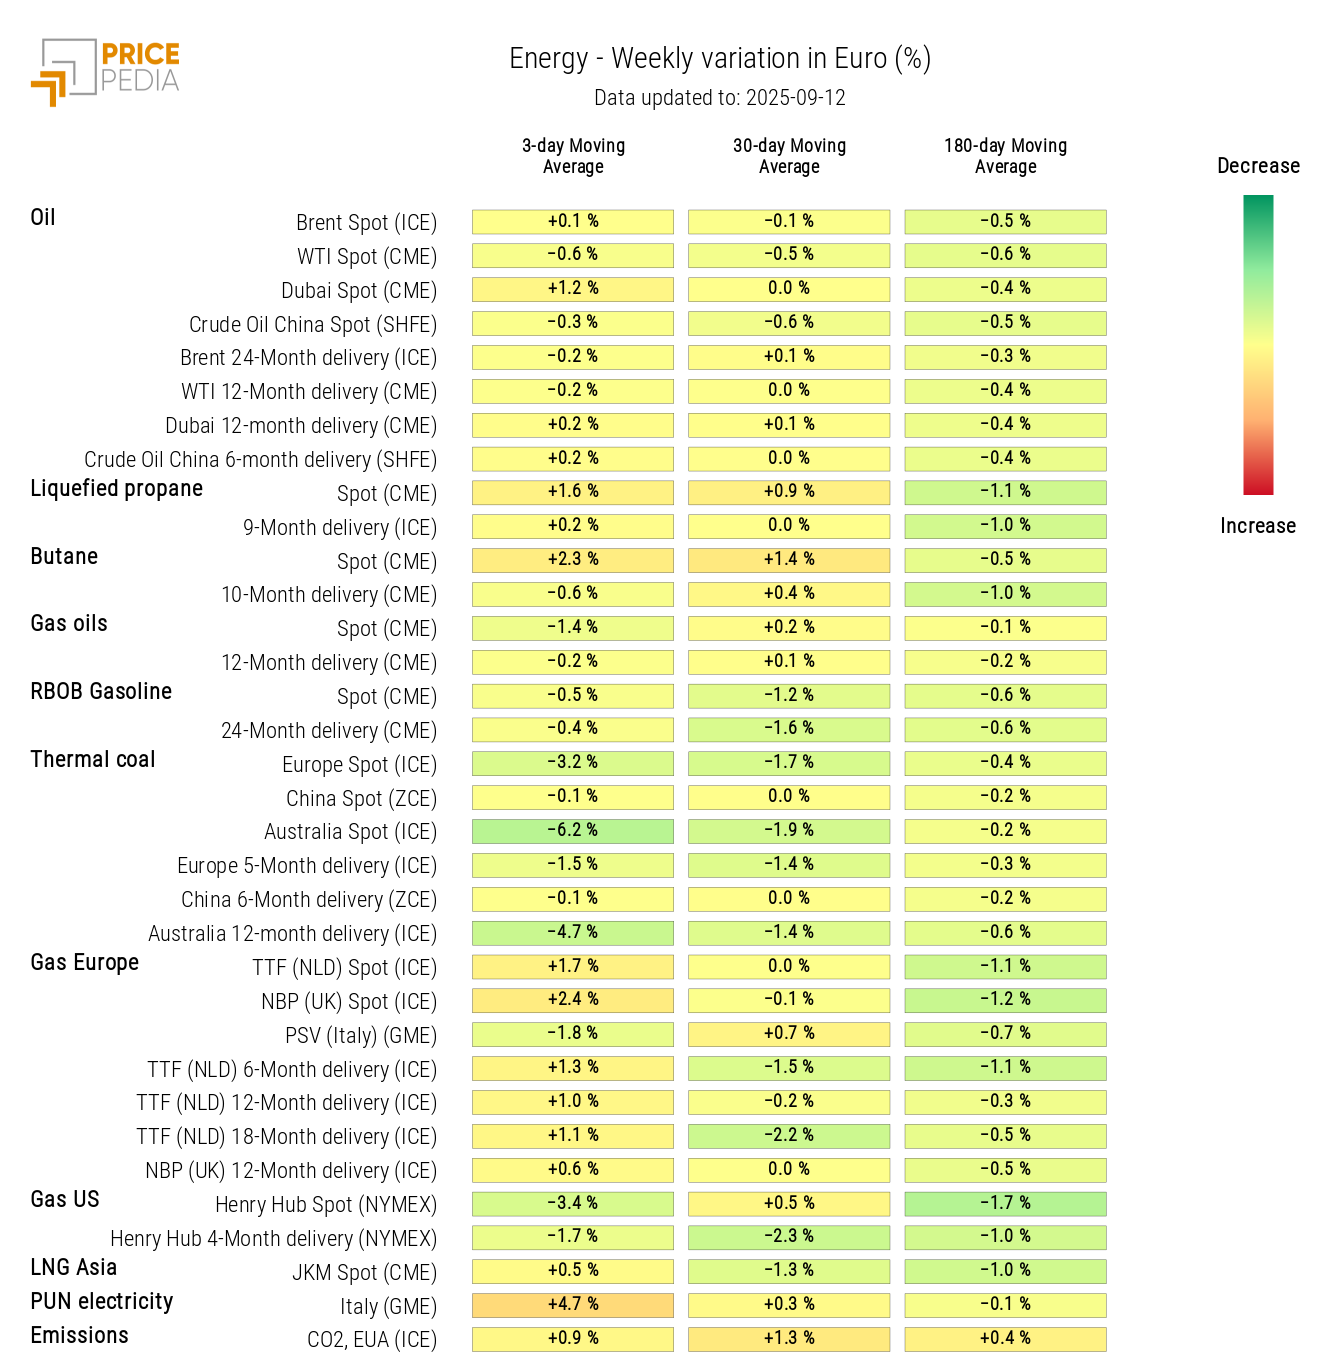
The energy heatmap shows a weekly increase in butane and natural gas prices in Europe, against a decline in thermal coal.
HeatMap of energy prices in euros
PRECIOUS METALS
This week too the financial index of precious metals reached new highs, albeit at a slower pace compared to the previous week.
PricePedia Financial Index of precious metals prices in dollars
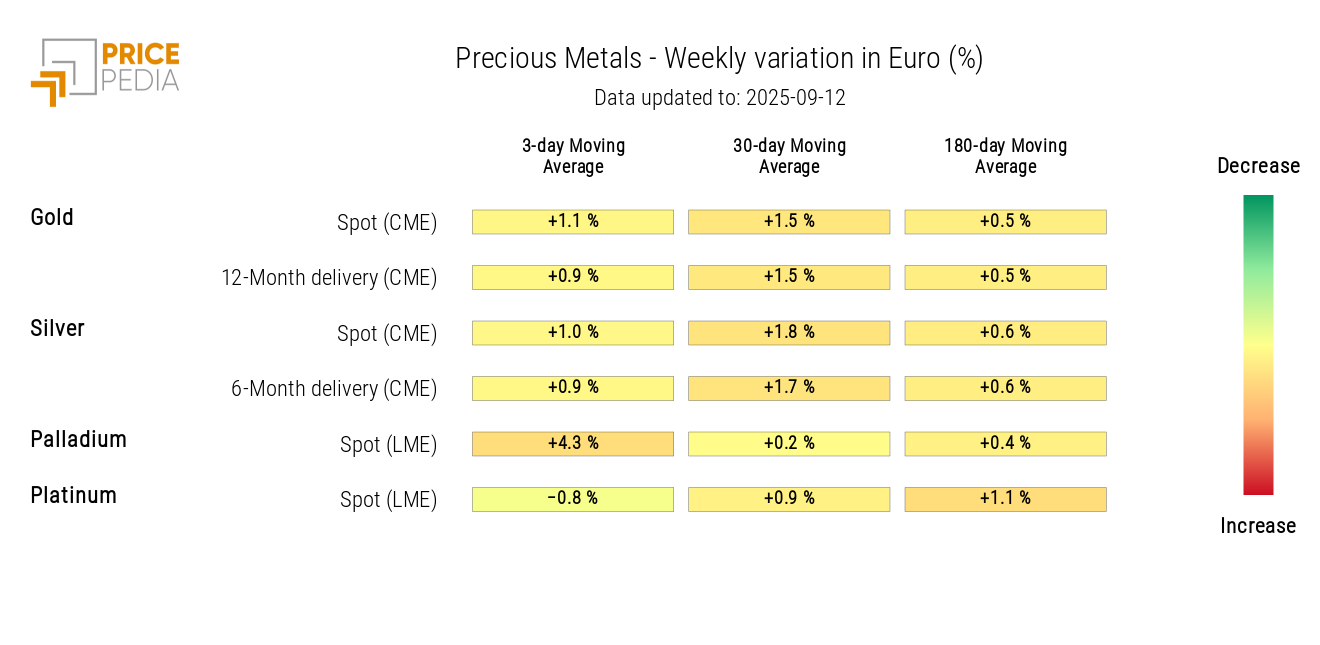
Analysis of the heatmap highlights an increase in the moving average of palladium and gold prices.
HeatMap of precious metals prices in euros
FERROUS
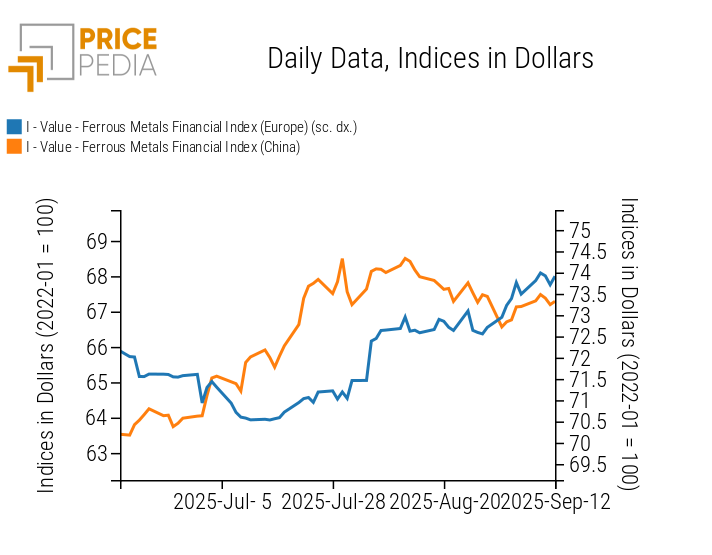
Net of fluctuations, the two ferrous metal indices recorded a slight increase in prices.
PricePedia Financial Indices of ferrous metals prices in dollars
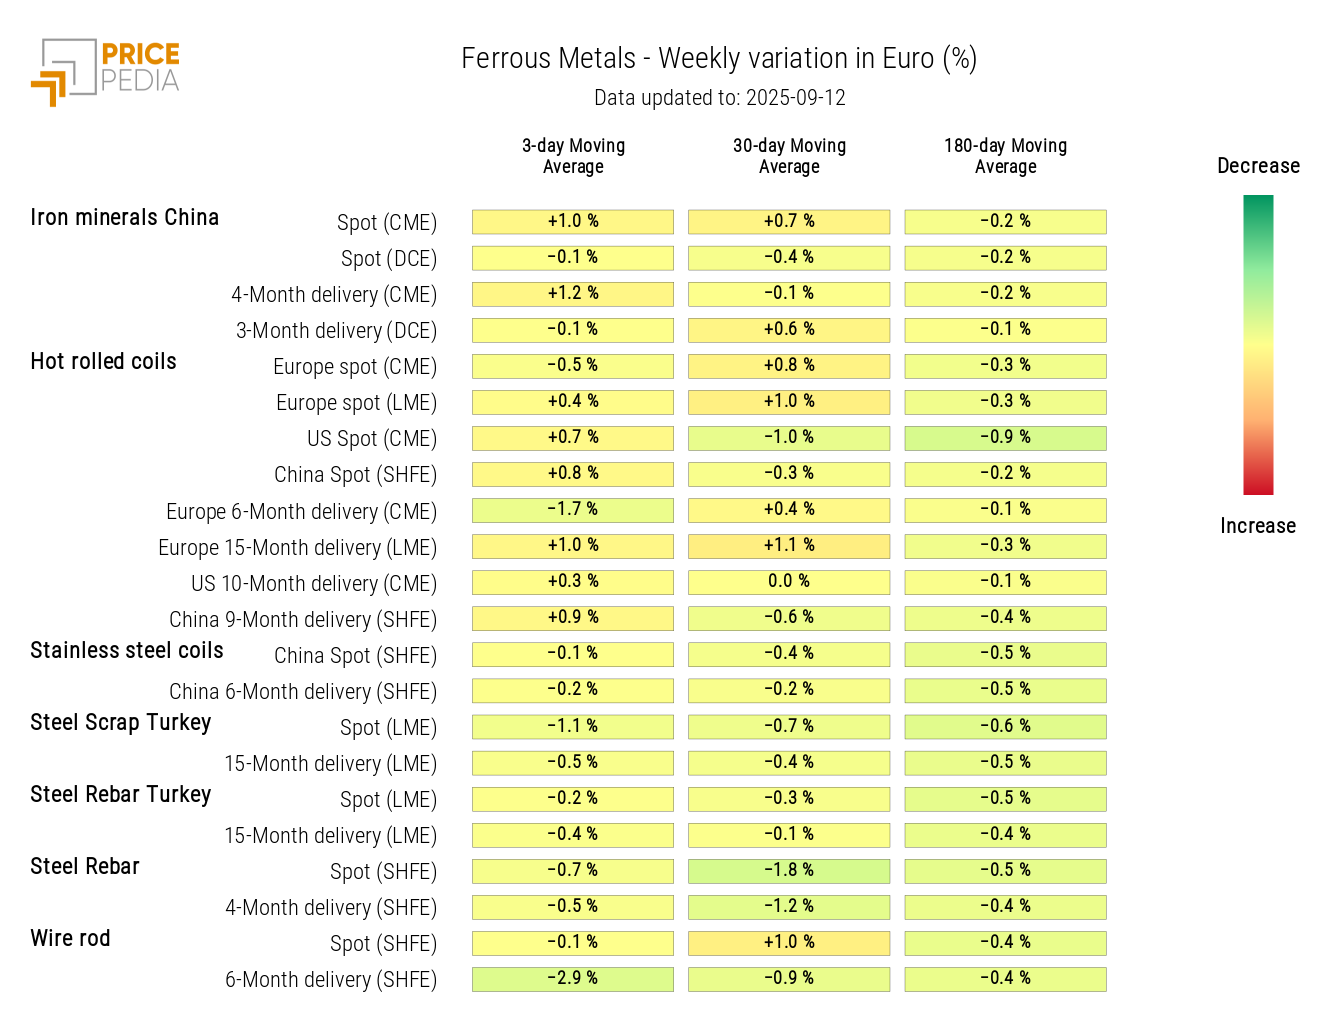
The ferrous metals heatmap shows very modest changes in prices.
HeatMap of ferrous metals prices in euros
Do you want to stay up-to-date on commodity market trends?
Sign up for PricePedia newsletter: it's free!
NON-FERROUS INDUSTRIALS
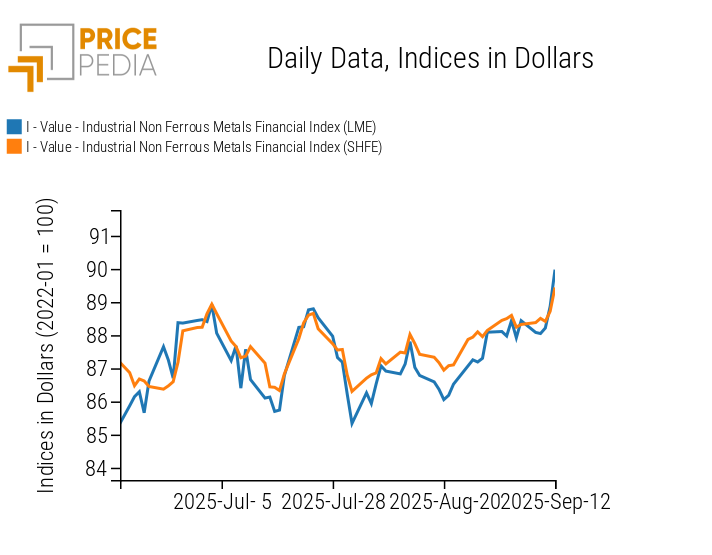
After a week start marked by stability, the two non-ferrous metal indices ended the week sharply higher.
PricePedia Financial Indices of non-ferrous industrial metals prices in dollars
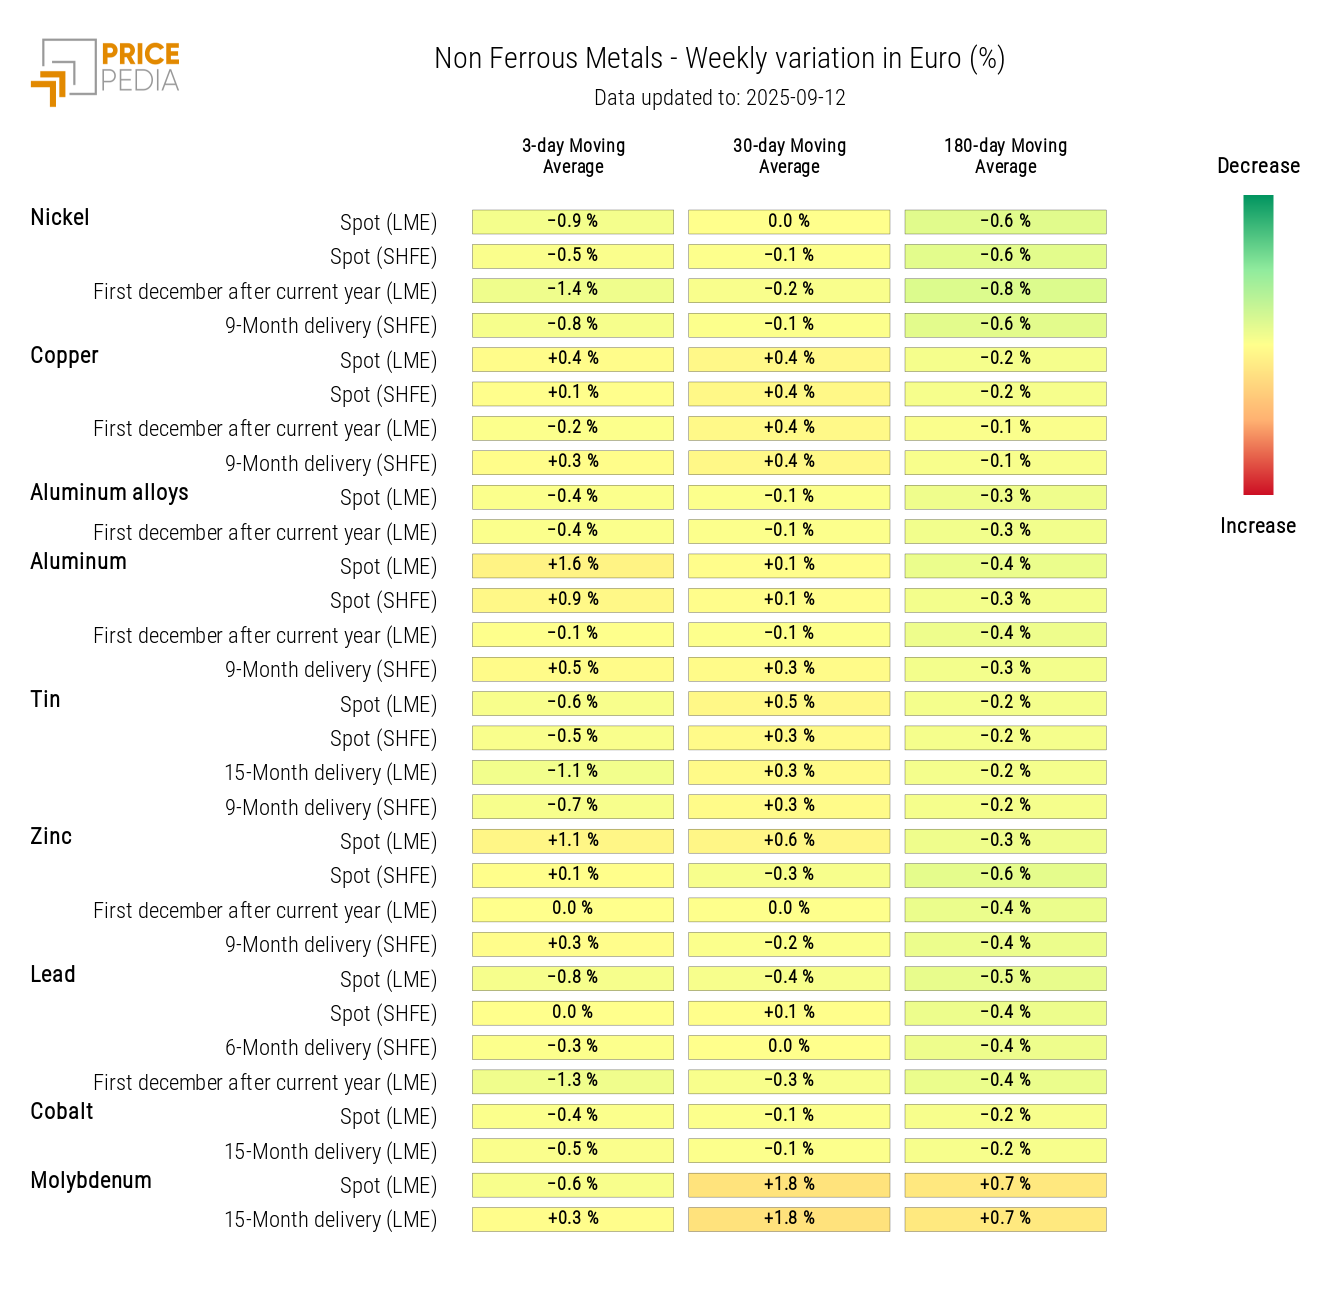
The non-ferrous metals heatmap of last week’s growth rates shows no individual cases of particularly sharp changes.
HeatMap of non-ferrous metals prices in euros
FOOD
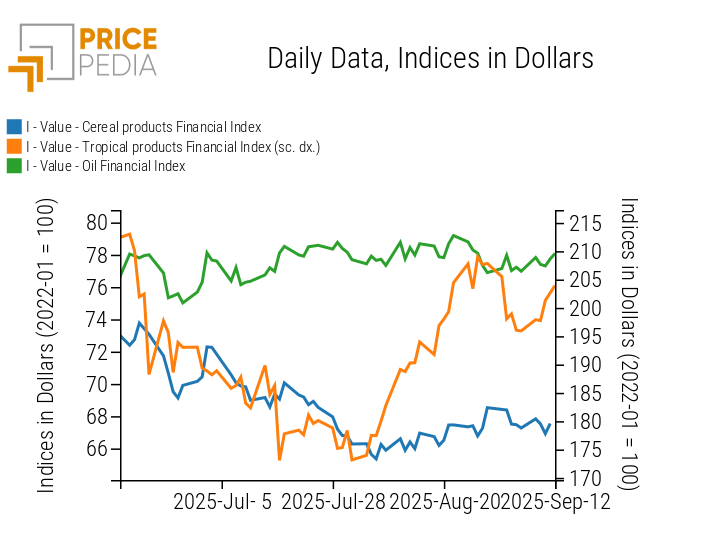
The financial index of tropical products recovers part of the decline recorded last week, while cereal and oil indices move sideways.
PricePedia Financial Indices of food prices in dollars
CEREALS
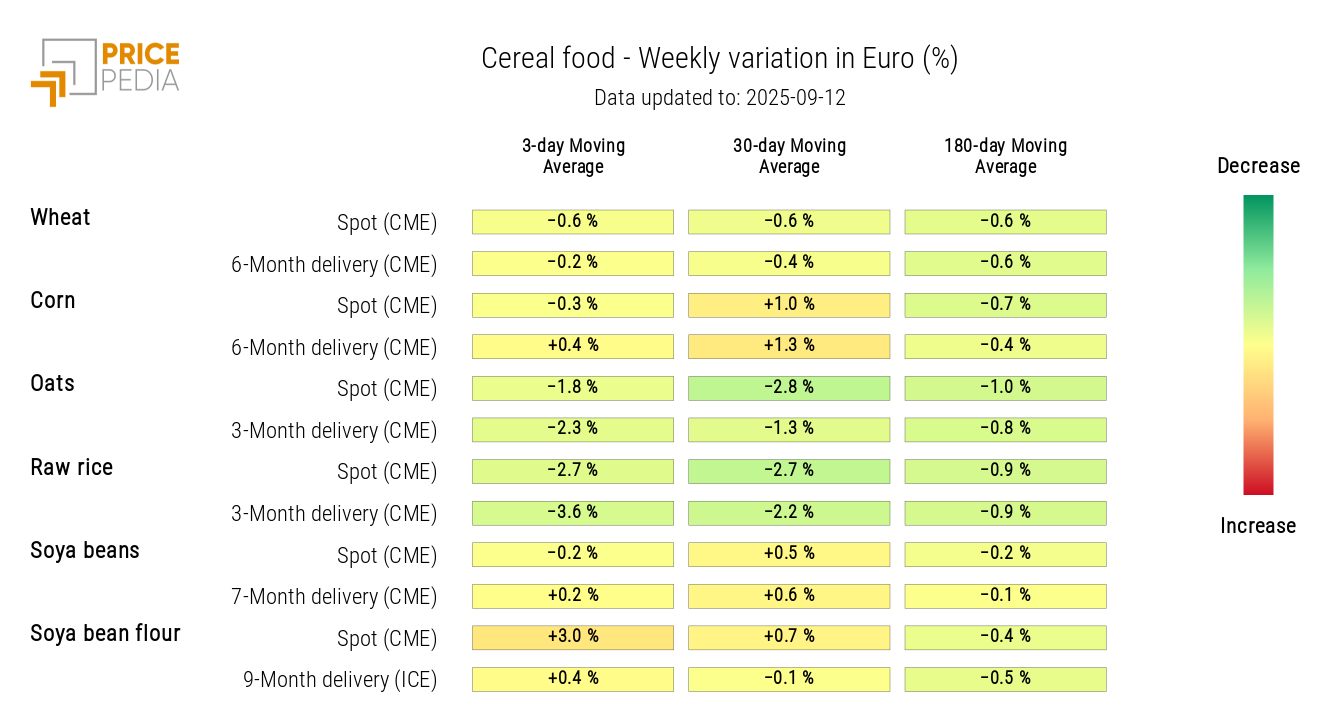
The heatmap shows a drop in raw rice and oats prices.
HeatMap of cereal prices in euros
TROPICALS
The tropicals heatmap highlights a rebound in coffee prices.
HeatMap of tropical food prices in euros
OILS
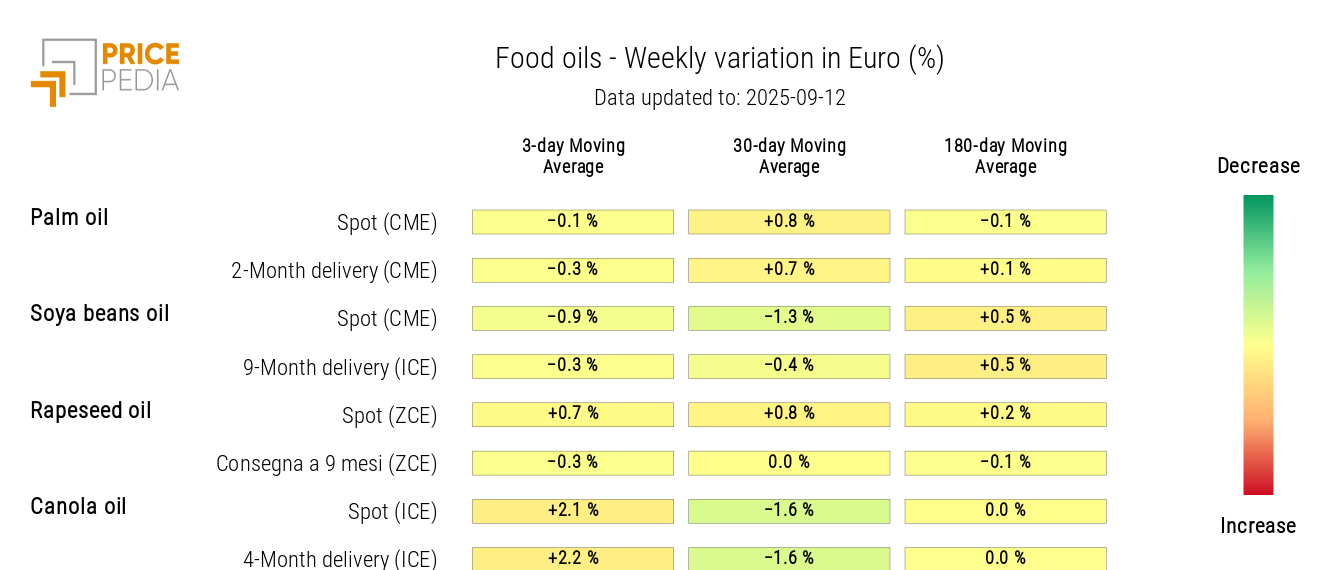
The heatmap shows a slight increase in canola oil prices.
HeatMap of food oils prices in euros
