Gold and silver hit record highs on expectations of interest rate cuts
Precious metals: a refuge from the weakness of the US dollar
Published by Luca Sazzini. .
Conjunctural Indicators Commodities Financial WeekThis week the financial prices of gold and silver reached new all-time highs. Precious metals were mainly driven by expectations of an imminent interest rate cut by the Federal Reserve, reinforced by the PCE inflation data released on Friday, which turned out to be in line with analysts' forecasts.
The prospects of a further weakening of the dollar, combined with the climate of political tension between the White House and the FED, have increased investors' demand for safe-haven assets, as they seek to protect themselves from a possible depreciation of the US dollar.
The rate cut now appears practically inevitable, especially in light of the negative labor market data released this Friday.
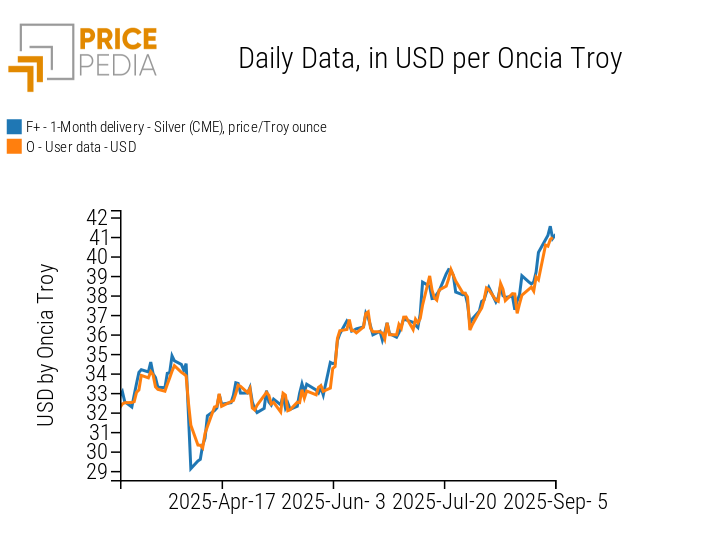
Gold and silver prices exceeded for the first time the thresholds of $3500/troy ounce and $40/troy ounce, recording increases of 34% and 38% respectively compared to the levels at the beginning of the year.
The chart below shows the historical series of the last 6 months of gold and silver prices, quoted on the Chicago Mercantile Exchange (CME) and the London Bullion Market Association (LBMA).
| Financial prices of gold, expressed in $/troy ounce | Financial prices of silver, expressed in $/troy ounce |

|
|
The strong growth of safe-haven assets such as gold and silver is due not only to expectations of a weaker dollar, but also to fears of possible corrections in the US stock markets, whose growth is increasingly concentrated in the technology sector.
The rise in gold was also supported by purchases from central banks, which continue to increase their reserves and, according to analysts, seem determined to continue on this path.
Weekly summary of commodity financial prices
The energy sector, net of fluctuations, was characterized by a weekly price decline.
Concerns about a possible increase in oil production ahead of the OPEC meeting on September 7 had a greater impact on the market than fears of potential US sanctions on Russia and China. Goldman Sachs even suggested a drop in oil prices to $50/barrel in 2026 due to the expected large supply surplus.
In the natural gas market, the agreement between Russian company Gazprom and Chinese CNPC for the construction of the Power of Siberia 2 pipeline was officially announced. The project aims to transport up to 50 billion cubic meters of gas per year from Western Siberia to Northern China through Mongolia, marking an important step in energy cooperation between the two countries. However, the news did not affect the financial prices of the TTF, which posted a modest increase this week, mainly due to reduced Norwegian gas flows to Europe caused by a six-day extension of maintenance work at the Troll field.
Among ferrous metals, a different trend was observed between the European and Chinese markets. The upward momentum in the European market was mainly driven by coils, whose prices increased due to longer delivery times resulting from the scheduled closure of some steel plants. In the Chinese market, on the other hand, prices initially fell on Monday but partially recovered during the week.
The non-ferrous metals markets remained overall stable on a weekly basis. The main changes concerned the prices of zinc and, above all, molybdenum, which recorded an increase. The rise in molybdenum intensified towards the end of July, when a sudden accident at a copper-molybdenum mine in Inner Mongolia raised concerns about supply stability, fueling the price rebound, further reinforced by declining inventories.
In the food market, prices of oils remained stable, cereals recorded a slight decline, and tropical products collapsed. The sharpest declines were seen in arabica coffee, influenced by heavy rainfall in Brazil that eased concerns about the next harvest, and by the appreciation of the dollar against the Brazilian real, which boosted Brazilian exports.
Cocoa posted the second-largest weekly drop, mainly due to improved weather conditions in Ivory Coast.
Sugar prices also fell, albeit less sharply than coffee and cocoa, supported by strong Brazilian production.
ENERGY
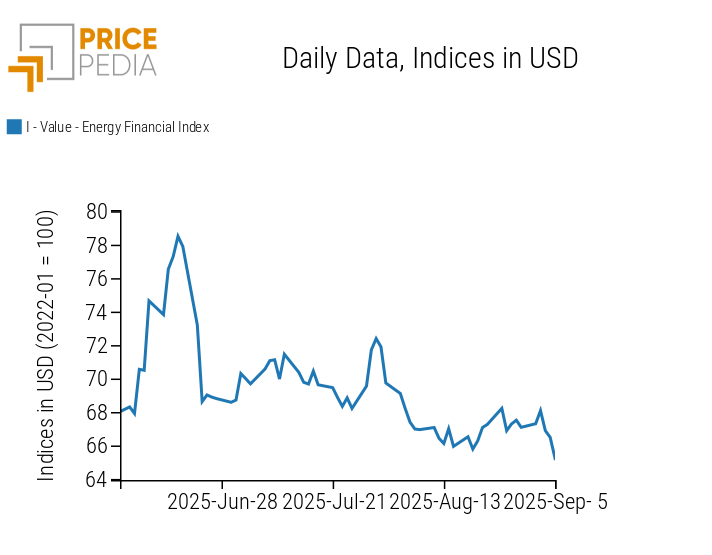
The PricePedia energy index, net of fluctuations, shows a weekly decline.
PricePedia Financial Index of energy prices in dollars
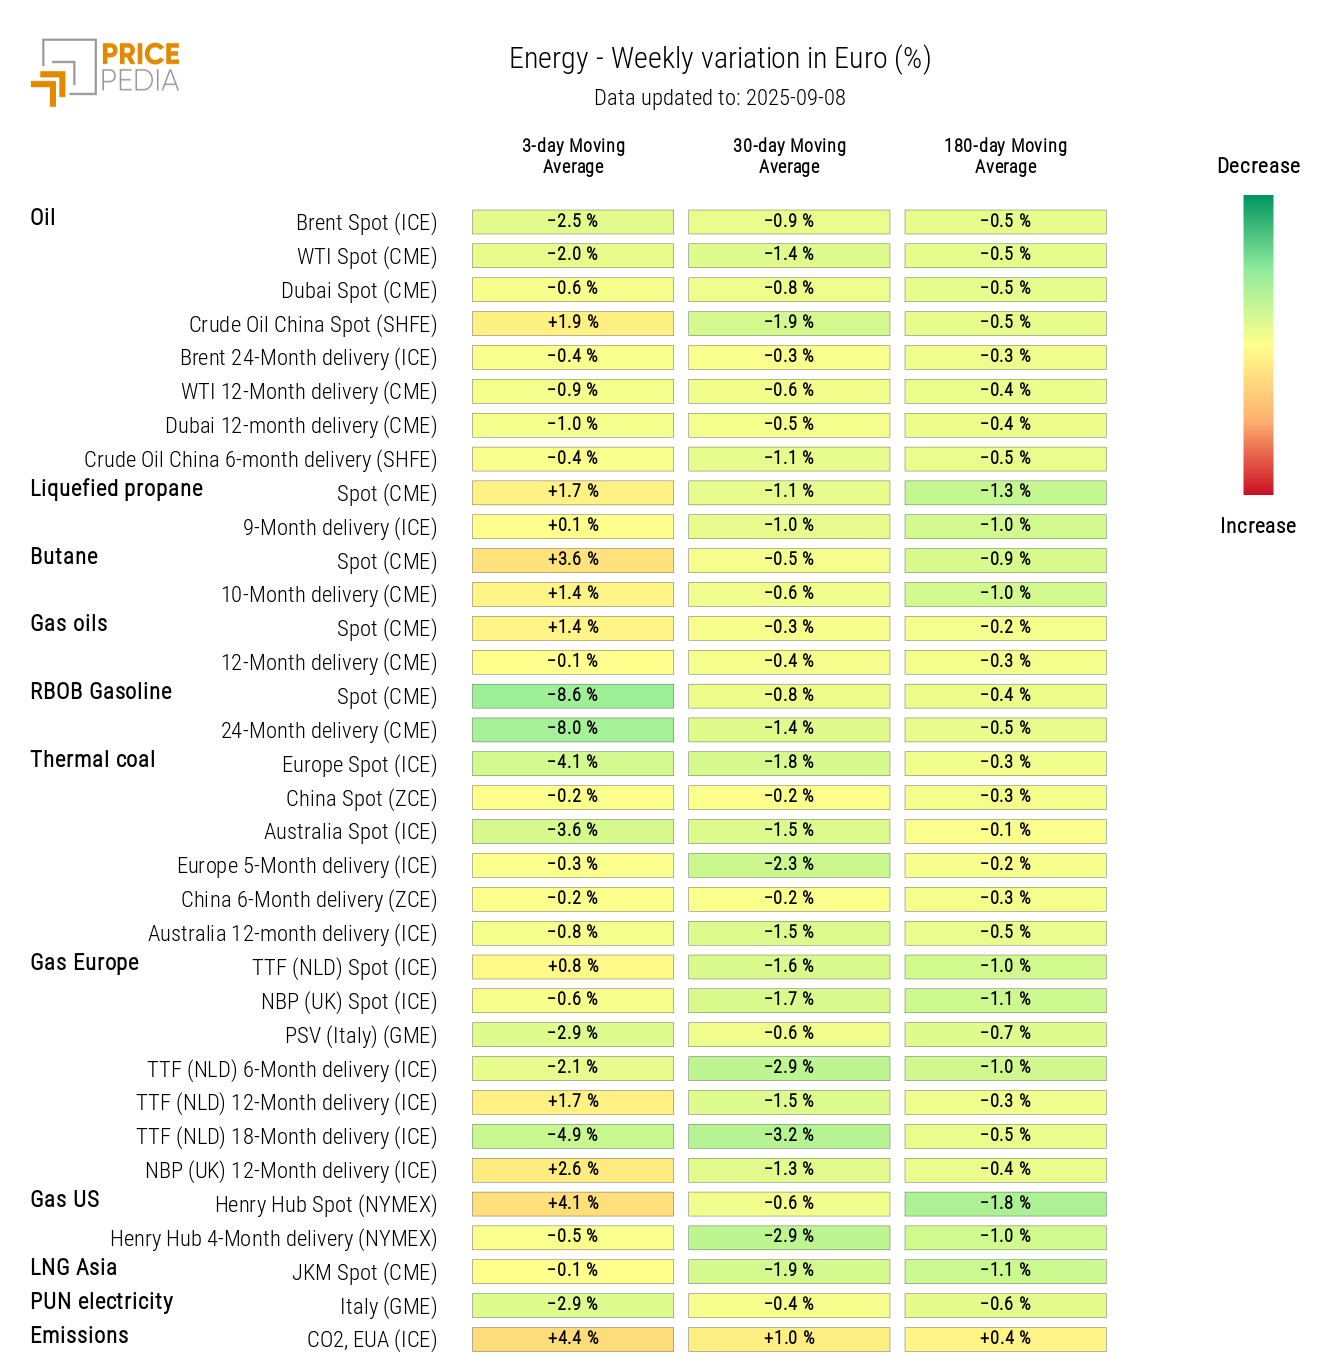
The energy heatmap highlights a decline in gasoline prices, alongside an increase in butane and US Henry Hub prices.
HeatMap of energy prices in euros
PRECIOUS METALS
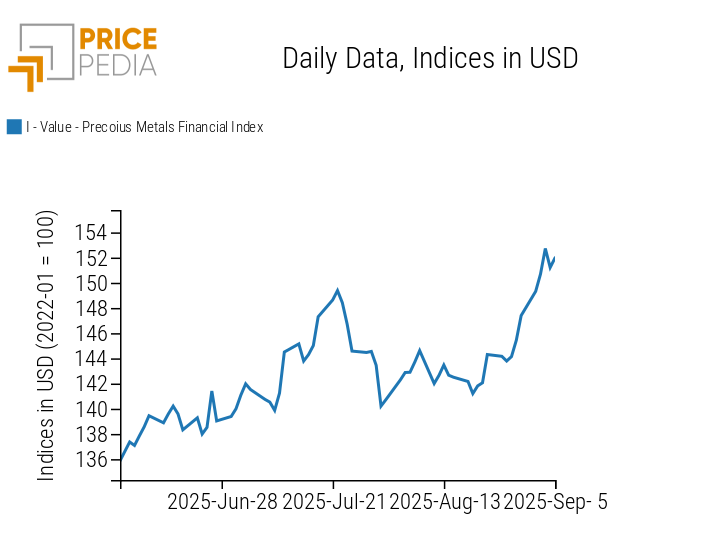
The financial index of precious metals reached a new all-time high on Wednesday, September 3, driven by expectations of an imminent rate cut by the FED.
PricePedia Financial Index of precious metals prices in dollars
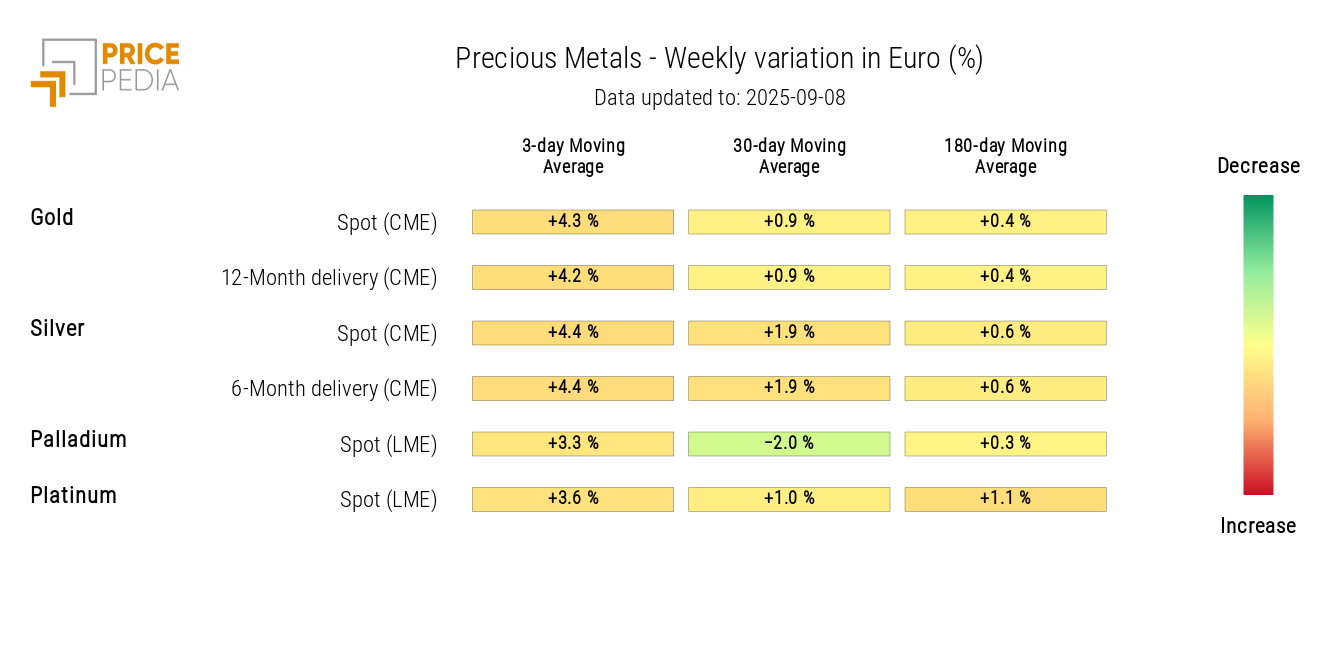
Heatmap analysis shows a generalized increase in precious metals prices.
HeatMap of precious metals prices in euros
FERROUS
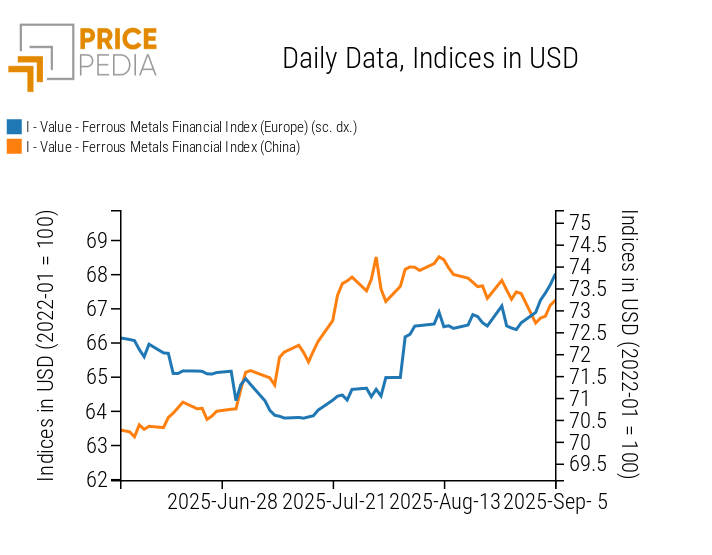
The European ferrous metals index shows a weekly upward trend, while the Chinese index, after Monday’s decline, partially recovered.
PricePedia Financial Indices of ferrous metals prices in dollars
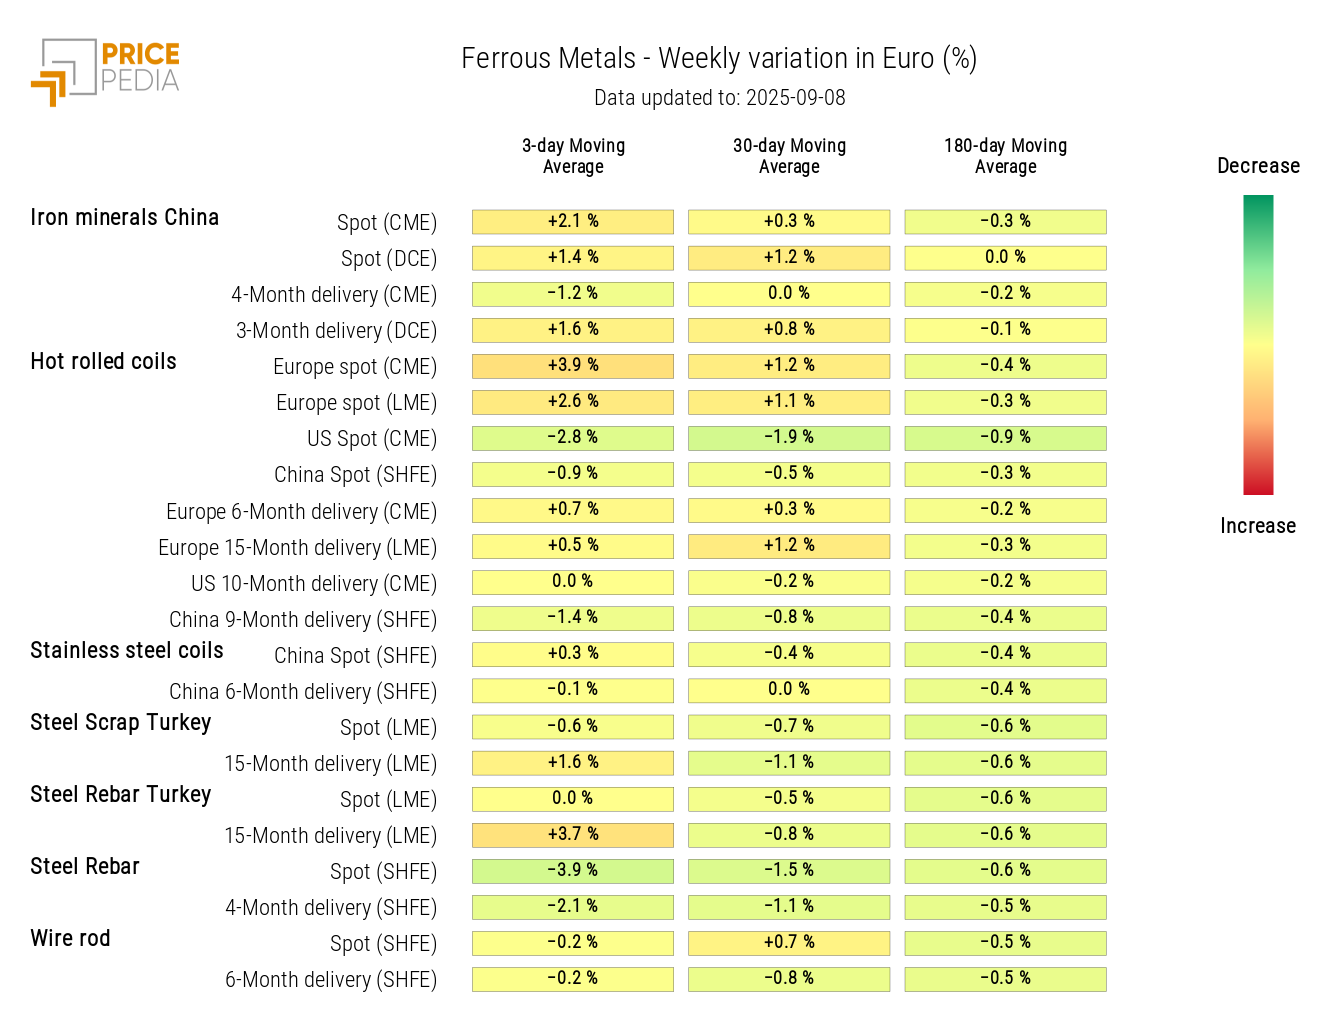
Heatmap analysis particularly highlights the increase in hot-rolled coil prices in Europe, due to longer delivery times resulting from the scheduled closure of some steel plants.
HeatMap of ferrous prices in euros
Do you want to stay up-to-date on commodity market trends?
Sign up for PricePedia newsletter: it's free!
INDUSTRIAL NON-FERROUS
Excluding weekly fluctuations, overall stability is recorded for non-ferrous metal prices.
PricePedia Financial Indices of industrial non-ferrous metal prices in dollars
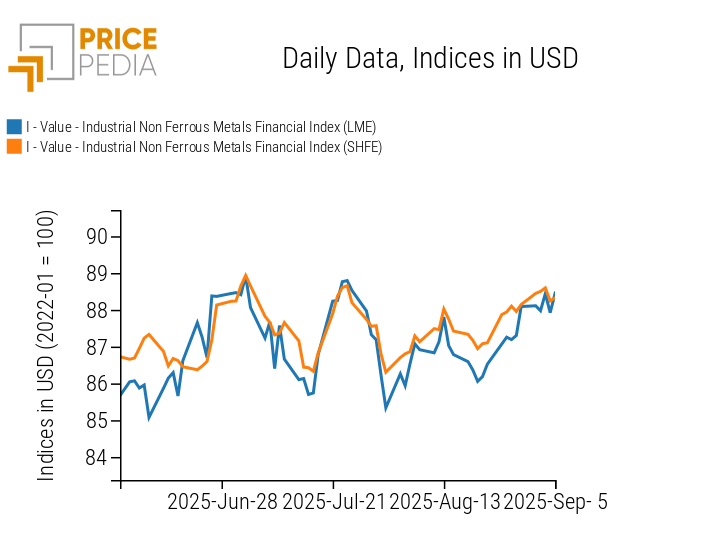
The non-ferrous heatmap highlights rising prices of zinc and, above all, molybdenum.
HeatMap of non-ferrous prices in euros

FOOD
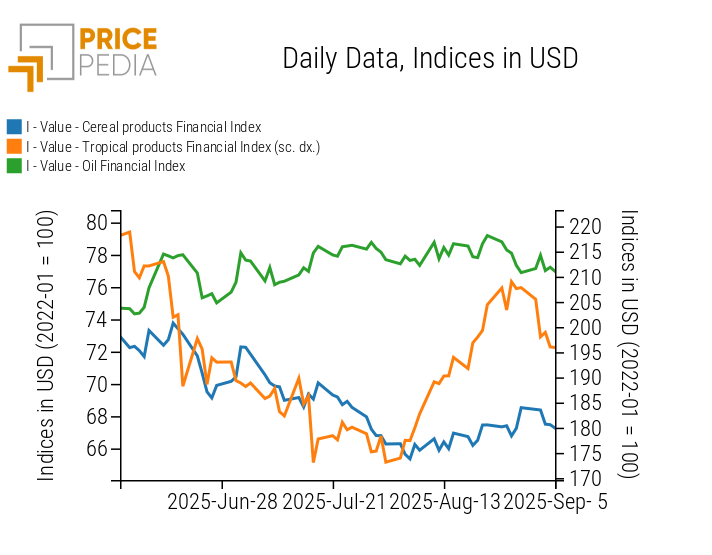
The financial index of tropicals shows a sharp weekly decline. The cereal and oil price indices recorded a slight decrease.
PricePedia Financial Indices of food prices in dollars
CEREALS
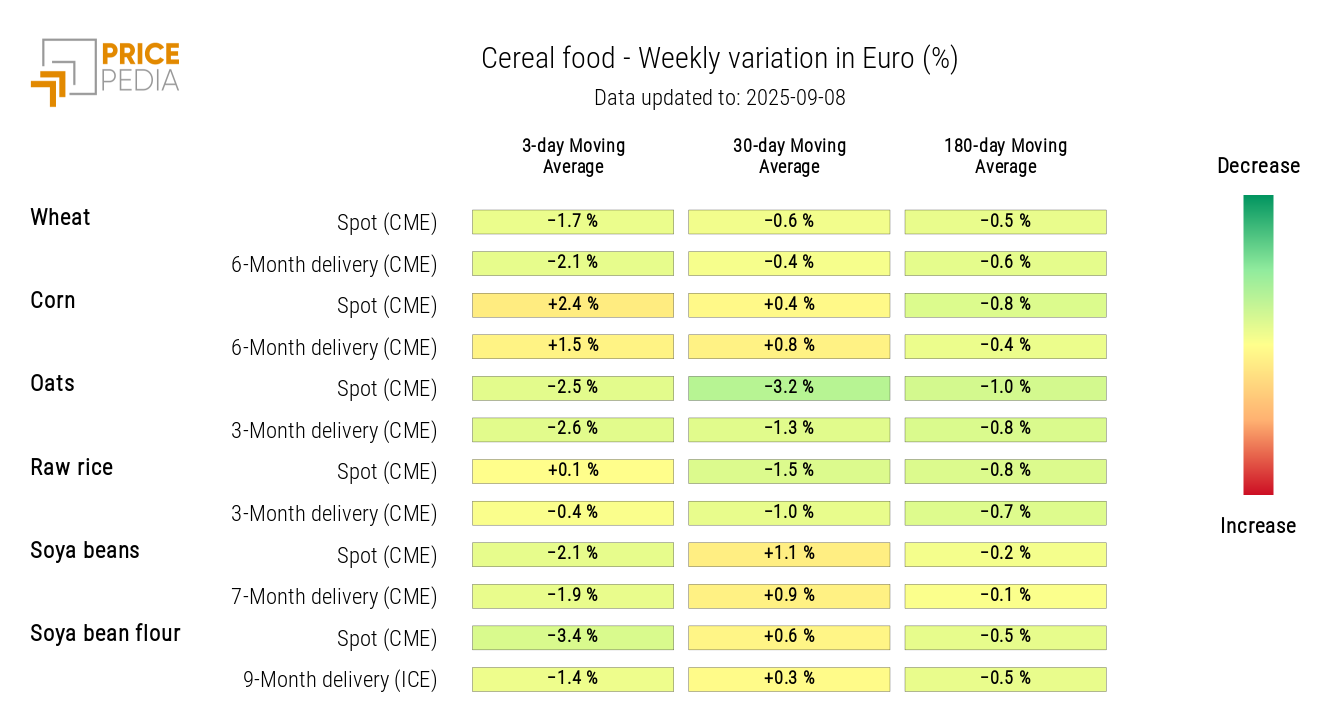
The heatmap shows an increase in corn prices, stable rice prices, and a decline in other cereals.
HeatMap of cereal prices in euros
TROPICALS
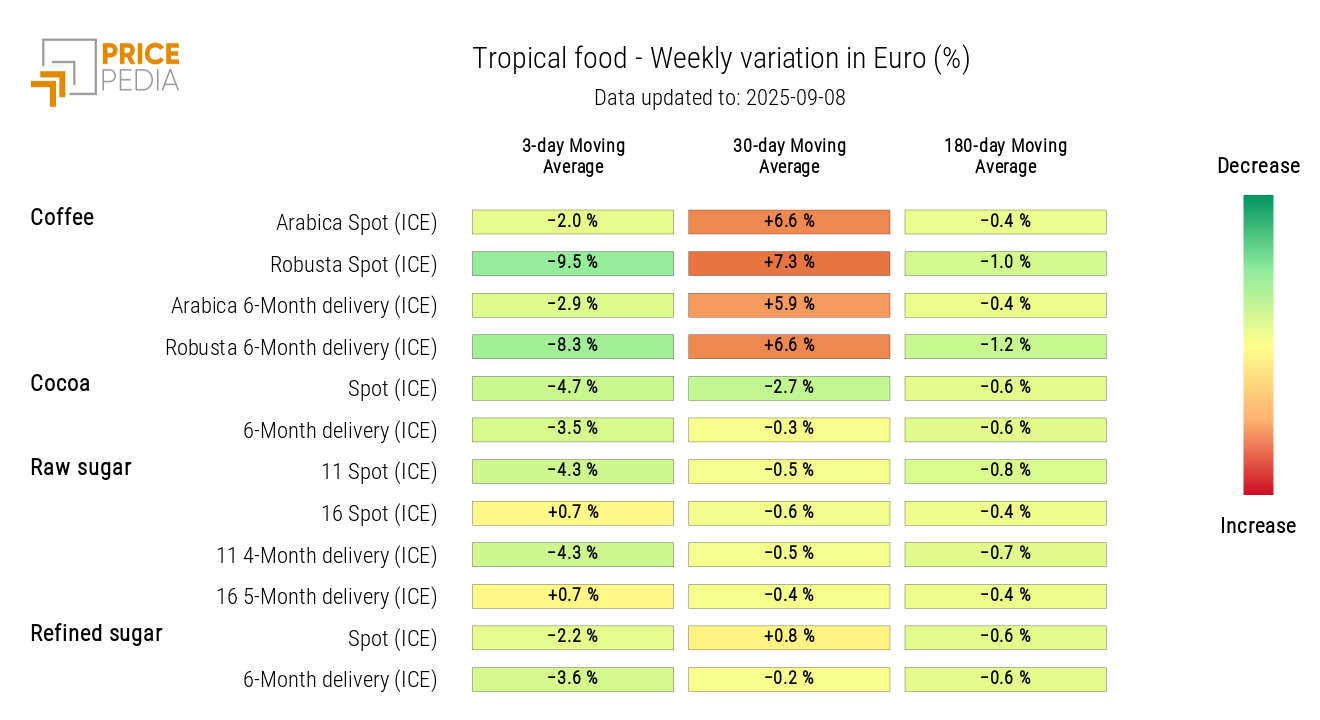
The tropical heatmap shows a weekly drop in prices, more pronounced for robusta coffee.
HeatMap of tropical food prices in euros
OILS
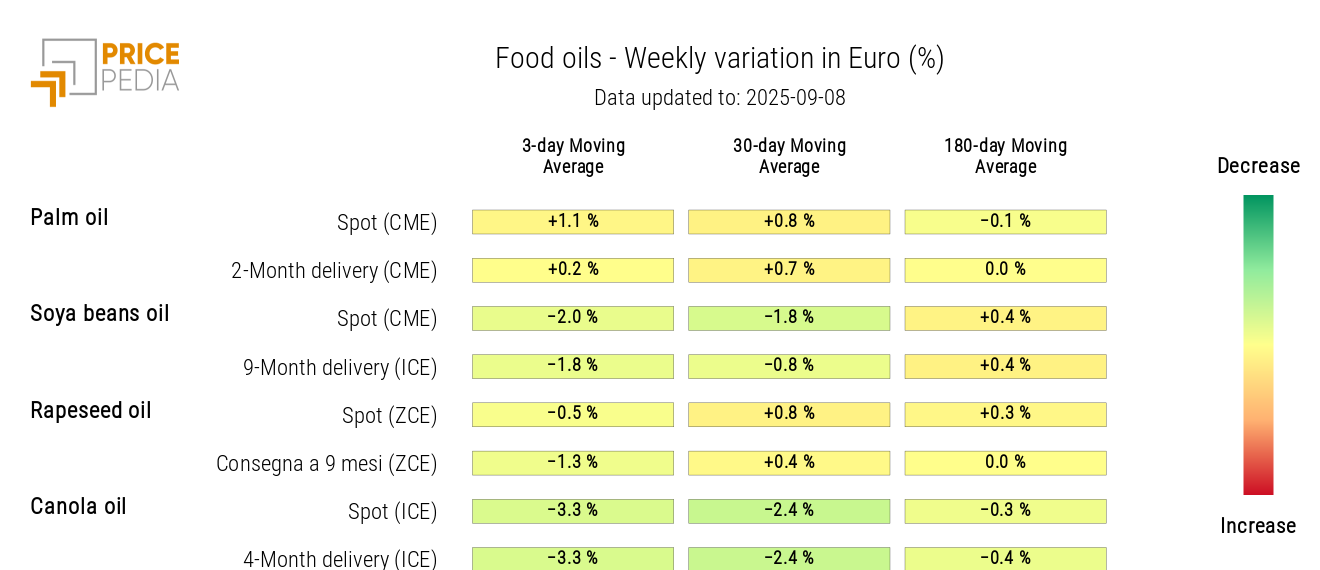
The heatmap shows a weekly drop in canola oil prices and a slight increase in palm oil.
HeatMap of food oil prices in euros
