Commodities awaiting interest rate cut
Unprecedented political pressure on the Fed
Published by Luca Sazzini. .
Conjunctural Indicators Commodities Financial WeekThis week, commodity financial markets were characterized by contrasting fluctuations, driven by speculative factors of different nature.
On Monday, energy and industrial metals markets recorded a bullish trend, supported by expectations of a possible easing of monetary policy by the Fed, following Jerome Powell's statements last Friday. The growing expectations of a rate cut supported commodity prices and contributed to the depreciation of the US dollar.
Further complicating the monetary policy outlook were the pressures exerted by President Trump, who on Monday announced the immediate removal of Governor Lisa Cook from the FED, accusing her of providing false information on personal mortgage loans requested from banks. Although Trump cannot actually dismiss a Board member without overwhelming evidence supporting just cause, the announcement nonetheless sparked fears about the independence of the central bank and the possible politicization of US monetary policy. Such concerns supported the depreciation of the US dollar, which in turn contributed to the increase in dollar-denominated financial commodity prices. This event is in fact unprecedented, being the first time that a US president has attempted to remove a member of the Federal Reserve Board of Governors.
After this initial rise, commodity prices then followed different dynamics, influenced by various short-term factors.
On Tuesday, oil prices declined, due to early profit-taking by operators, given levels not supported by fundamentals. Subsequently, prices rose again due to renewed Russian attacks on Ukrainian energy infrastructure, confirming Russia’s unwillingness to pursue a peace agreement with Ukraine and fueling fears of possible tariffs by the Trump administration. At present, however, Trump’s threats have not yet translated into harsher tariffs against Russia and China, the main buyer of Russian oil. The only exception concerns India: on Wednesday, August 27, US tariffs of 50% on Indian imports officially came into effect, imposed due to the country’s high purchases of Russian oil.
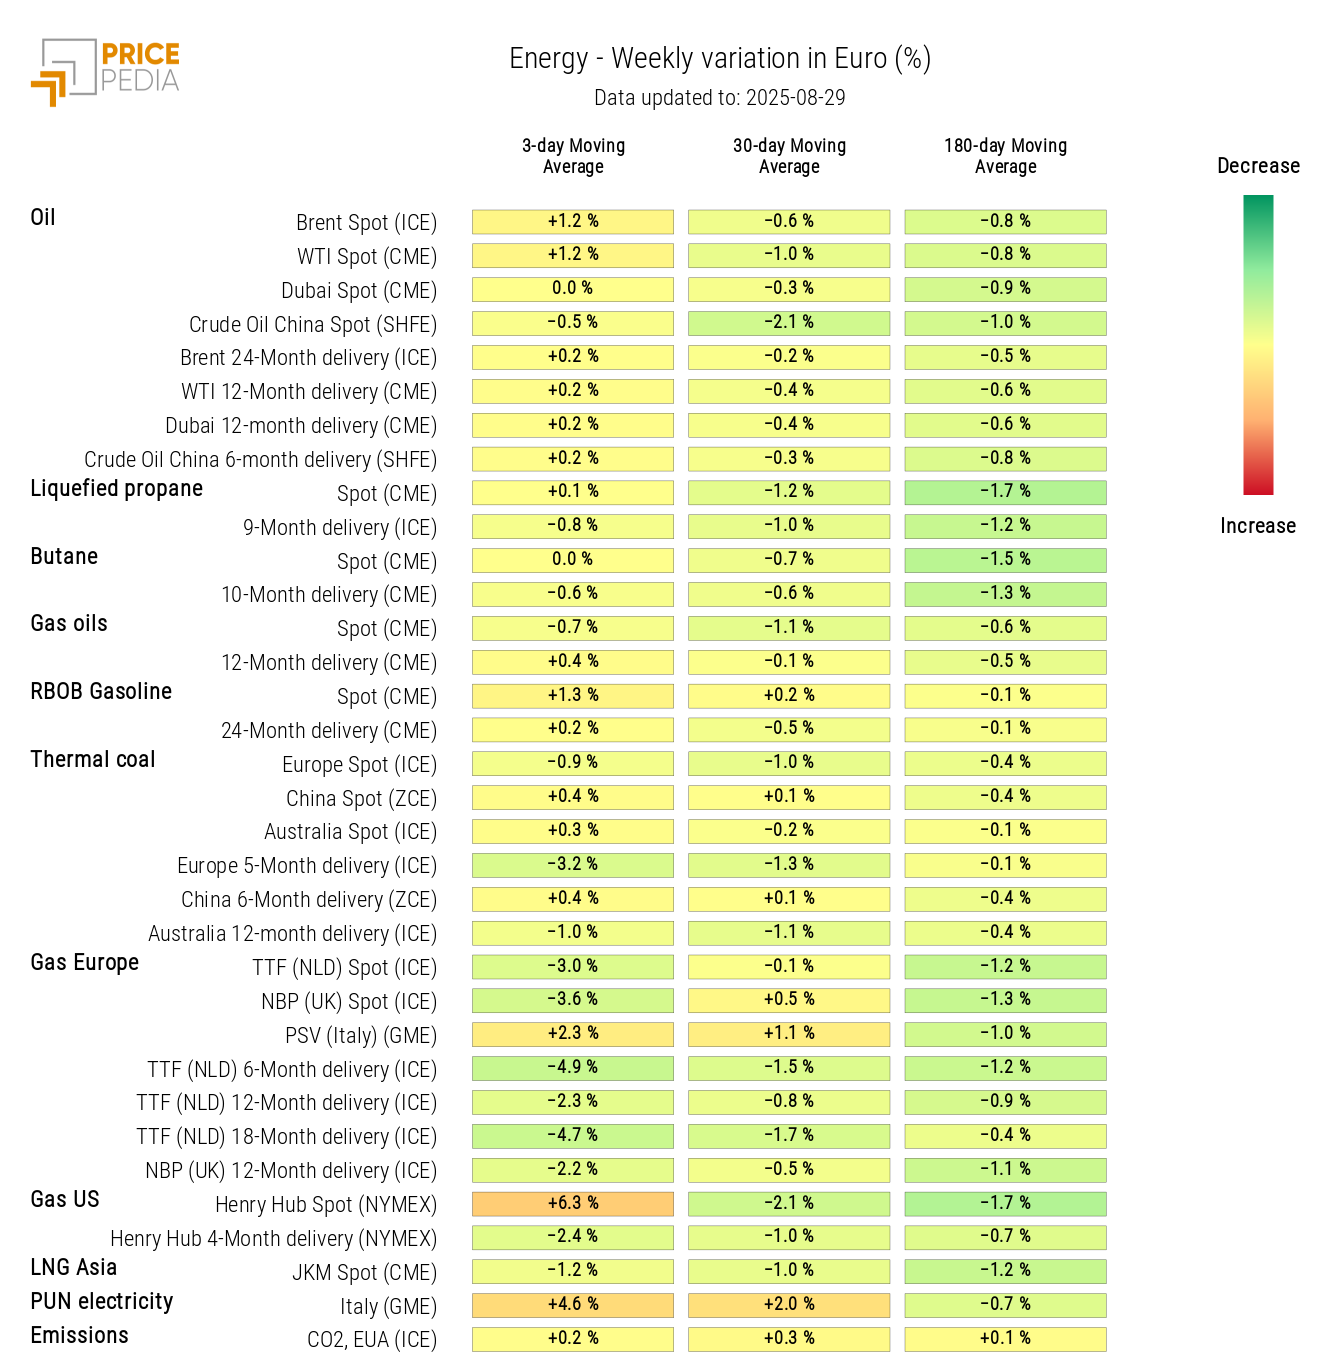
In the European TTF natural gas market (Netherlands), the recent upward trend in prices reversed, despite reduced gas flows from Norway due to maintenance work. Supporting the decline in European gas prices was the growth in EU storage levels, which reached almost 77% of capacity, while still remaining below the five-year seasonal average of 84%.
Among industrial metals, ferrous metal prices remained relatively stable, while non-ferrous metals recorded slight overall increases, more pronounced in the tin market.
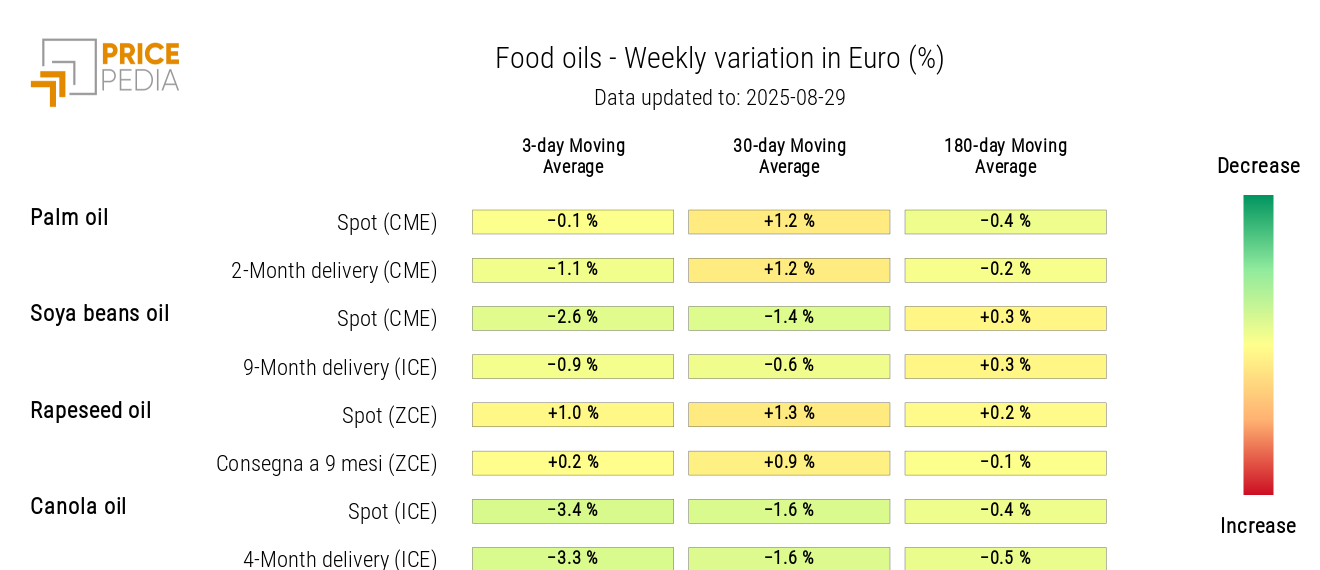
In the food sector, dynamics also diverged: oil prices declined, driven by the fall in canola oil and soybean oil, while tropical commodities, such as coffee and cocoa, stabilized after sharp fluctuations the previous week. For cereals, weekly variations showed a slight increase for wheat and corn, while oat prices contracted.
US Inflation
New inflation data in the United States indicate price growth in line with analysts' expectations.
The July Personal Consumption Expenditures (PCE) confirmed an inflation increase of 2.6% on a year-on-year (y/y) basis, stable compared to June's annual variation.
The core PCE index, excluding more volatile components such as energy and food, grew by 0.3% on a monthly (m/m) basis and 2.9% on a year-on-year (y/y) basis, also in line with forecasts.
Since these results hold no surprises for the Federal Reserve, markets continue to price in with near certainty the next interest rate cut at the September meeting, especially in light of Powell's latest speech last Friday.
NUMERICAL APPENDIX
ENERGY
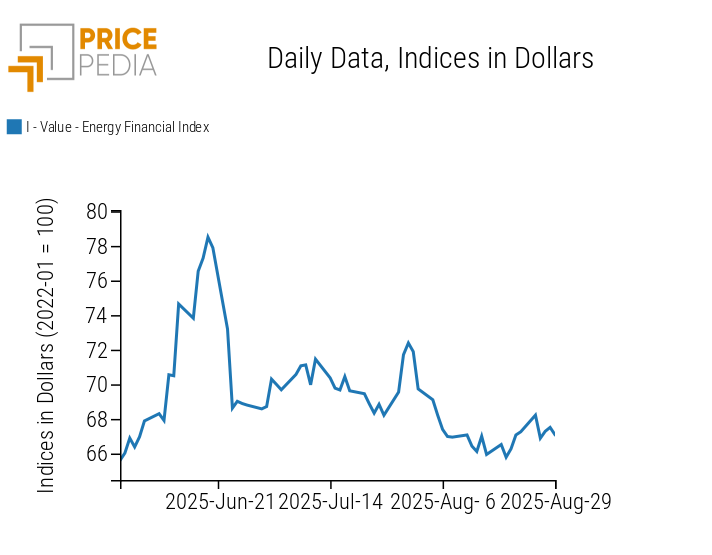
The PricePedia financial index of energy products shows price fluctuations that offset each other.
PricePedia Financial Index of energy prices in dollars
The energy heatmap highlights a decline in European natural gas prices and an increase in US ones.
HeatMap of energy prices in euros
PLASTICS
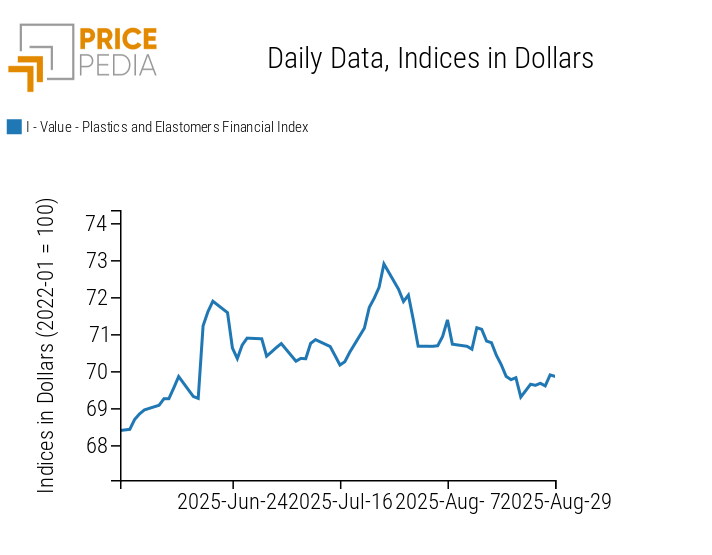
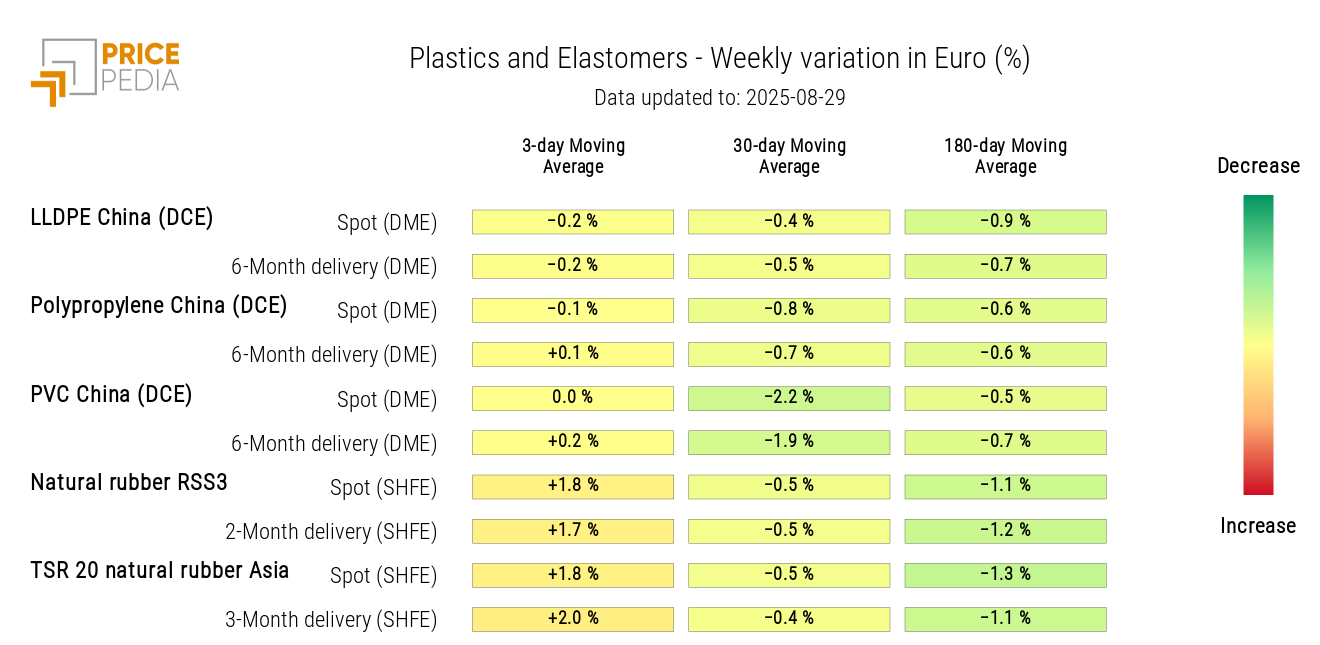
The Chinese financial index of plastics and elastomers remained stable at the beginning of the week, then increased due to rising natural rubber prices.
PricePedia Financial Indices of plastics prices in dollars
The heatmap analysis shows an increase in elastomer prices and stable plastic prices.
HeatMap of plastics and elastomers prices in euros
FERROUS
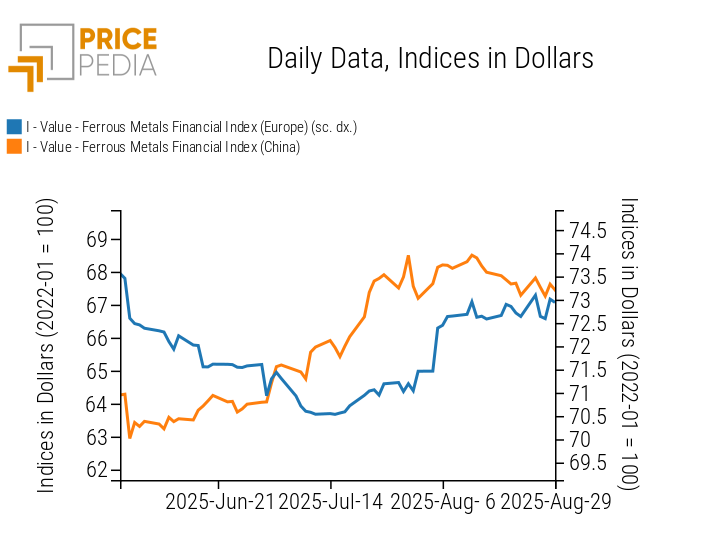
Both ferrous metals indices show a mostly sideways weekly trend, with greater fluctuations for European prices compared to Chinese ones.
PricePedia Financial Indices of ferrous metals prices in dollars
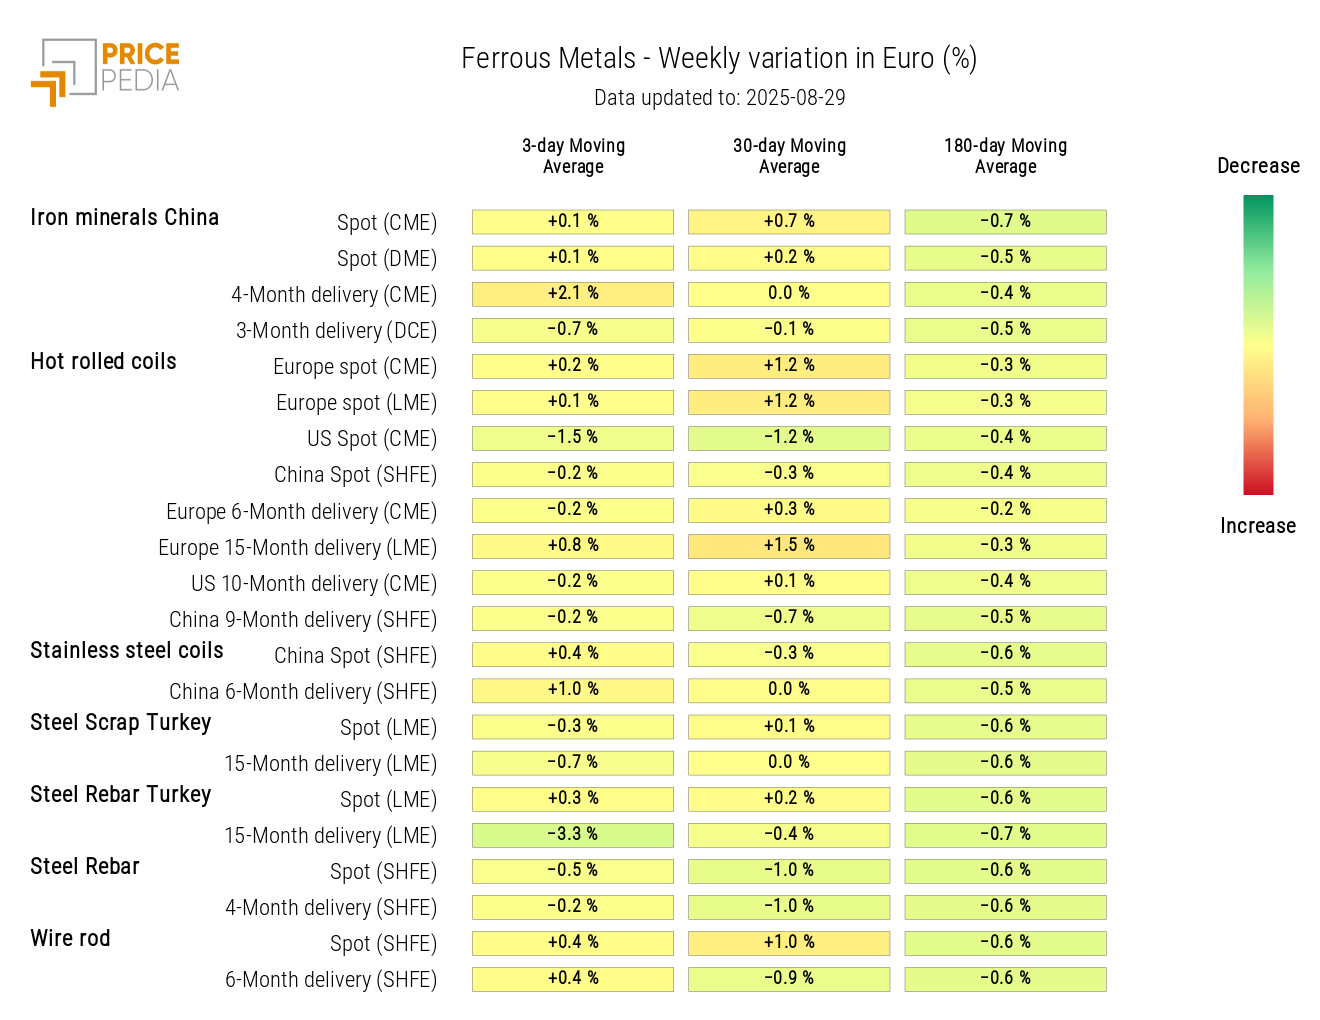
The heatmap analysis shows the stability of financial ferrous metal prices, with almost no spot price changes on a weekly basis.
HeatMap of ferrous prices in euros
Do you want to stay up-to-date on commodity market trends?
Sign up for PricePedia newsletter: it's free!
NON-FERROUS INDUSTRIALS
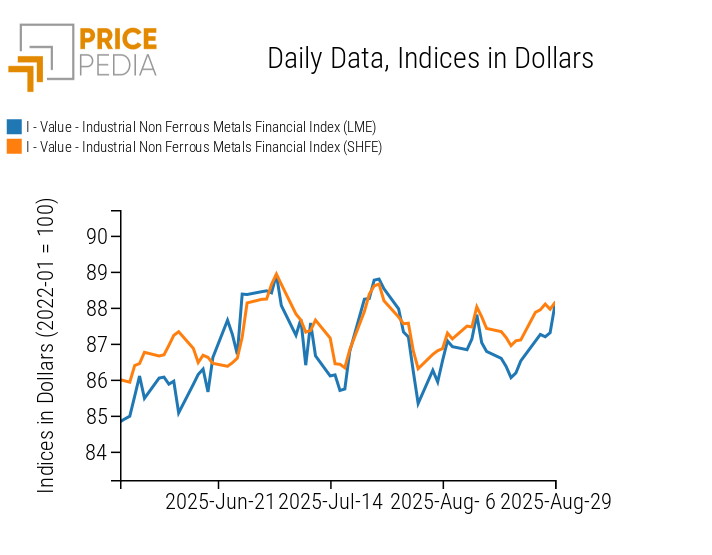
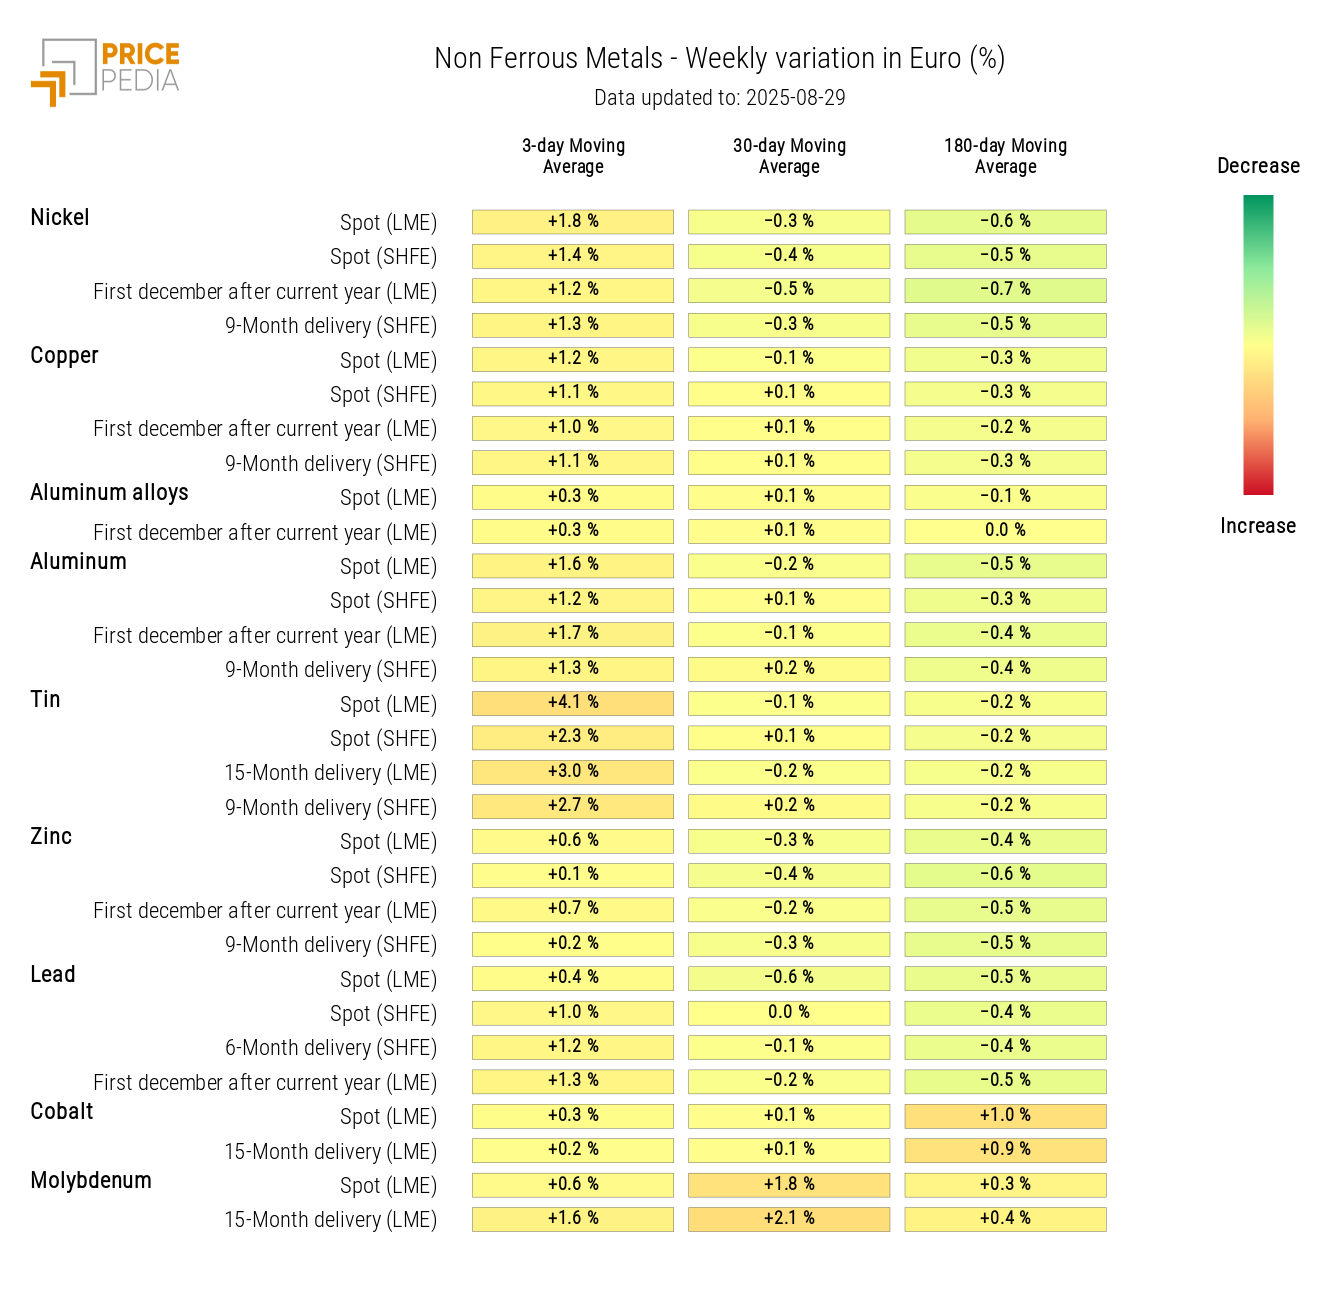
Both non-ferrous metal indices recorded a price increase during the week, within a phase characterized by wide fluctuations.
PricePedia Financial Indices of non-ferrous industrial metals prices in dollars
The non-ferrous metals heatmap highlights a slight weekly price increase, more pronounced for tin.
HeatMap of non-ferrous prices in euros
FOOD
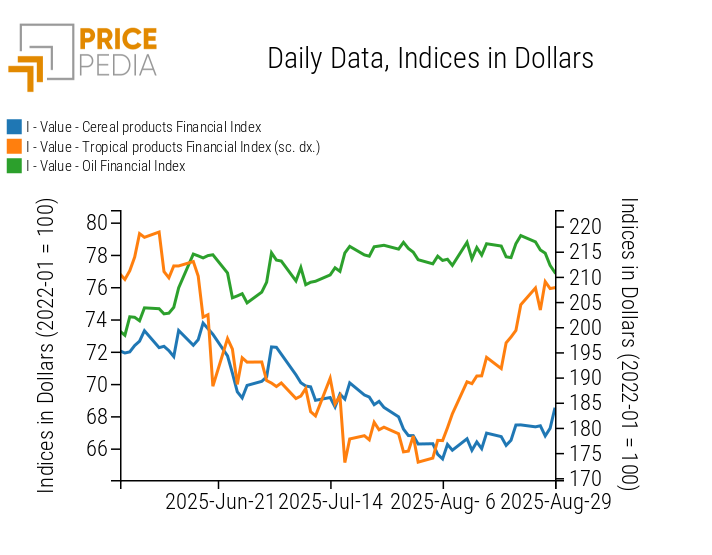
Food indices indicate a weekly decrease in oil prices and a slight increase in tropical and cereal prices.
PricePedia Financial Indices of food prices in dollars
CEREALS
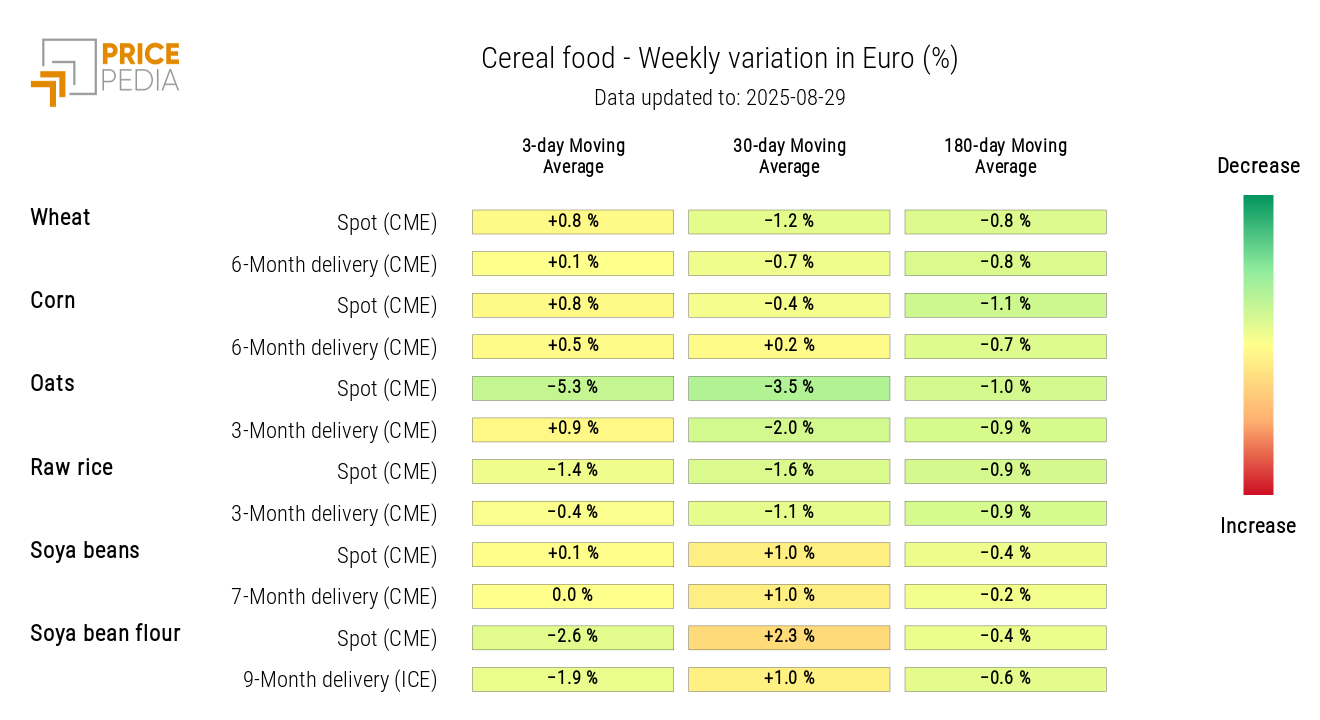
The cereals heatmap highlights a decline in oat and soybean meal prices, alongside a slight increase in wheat and corn prices.
HeatMap of cereal prices in euros
TROPICALS
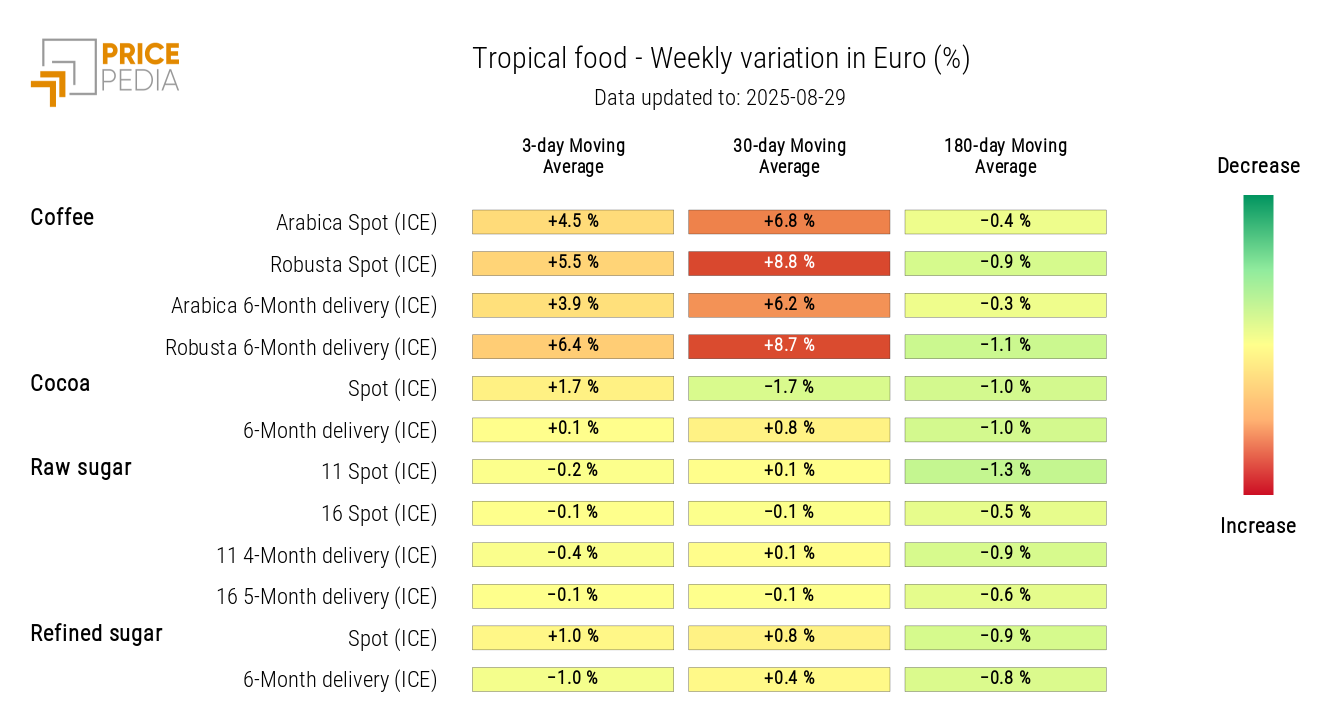
This week, the 3-day moving average growth of coffee prices slowed, while cocoa prices showed a slight recovery.
HeatMap of tropical food prices in euros
OILS
The heatmap of edible oils highlights a weekly decline in canola oil and soybean oil prices.
HeatMap of edible oil prices in euros
