Chinese Export Prices of Organic Chemistry Commodities Continue to Decline in Euro Terms
The downward pressure on European prices varies across cases
Published by Luigi Bidoia. .
Organic Chemicals Price Drivers
From the beginning of 2025 to the end of July, Chinese export prices of industrial commodities in euro fell by -14%, compared to a much smaller decrease of -2.2% in European industrial commodity prices over the same period. A key factor was the depreciation of the yuan (more closely tied to the dollar) against the euro, amounting to 9% during this timeframe. However, even after accounting for this exchange rate effect, the sharper decline in Chinese prices relative to European prices remains significant.
Historically, the two indices have been highly correlated, as shown in the chart below.
PricePedia indices for industrial commodities: comparison between European and Chinese prices
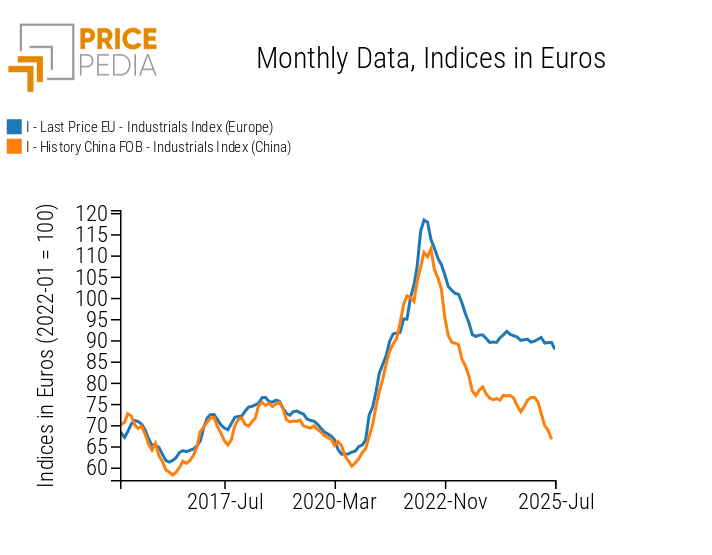
The correlation between the two series increases slightly when Chinese export prices are lagged by one month. This suggests a causal relationship running from Chinese to European prices. In other words, the sharp drop in Chinese export prices observed in 2025 is statistically likely to be exerting downward pressure on commodity prices in the European market. So far, this pressure has translated into only a modest decline in European prices, but its effects could intensify in the coming months.
To better understand this dynamic, the following analysis focuses on the prices of organic chemistry commodities.
Chinese and European Prices of Organic Chemistry Commodities
As highlighted in the article China Takes the Lead in Organic Chemistry: A New Landscape for European Sourcing, in recent years China has made a significant leap forward in its share of global trade in organic chemistry products. This has allowed it to pull ahead not only of European countries, but also of the United States, which remains the world’s second-largest exporter—though increasingly distant from China’s leadership.
The following table compares the annual growth rates of Chinese export prices for organic chemistry commodities with the corresponding European average prices[1]. In both cases, values are expressed in euros, making the two trends immediately comparable.
Organic Chemistry: Comparison of Chinese and European Prices (annual growth rates in euro)

The data in the table clearly show that in 2021 Chinese prices grew more than 10% faster than European prices, only to decelerate more sharply in 2022 and then record steeper declines over the following three years. Looking at the cumulative change since 2019—considered a year of market balance before the pandemic shock—by 2025 European organic chemistry commodity prices will have increased by 25%, while Chinese prices, on average this year, will stand below their 2019 levels.
What applies to the overall set of commodities therefore also holds true for organic chemistry: the widening negative gap between Chinese and European prices is creating growing downward pressure on European prices, with the potential for further reductions in the coming months.
Within the family of organic chemistry commodities, however, product-specific differences remain significant: in some cases, the current price gap is similar to that of 2019, while in others it has widened considerably. Based on these differing dynamics, it is useful to classify organic chemistry commodities into two groups: those where the price differential between Europe and China has remained relatively stable, and those where it has expanded significantly.
Group of Prices with a Relatively Stable Differential
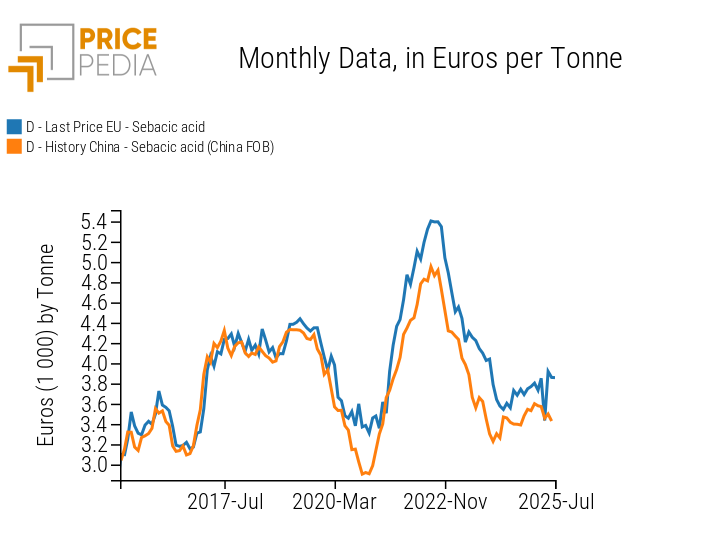
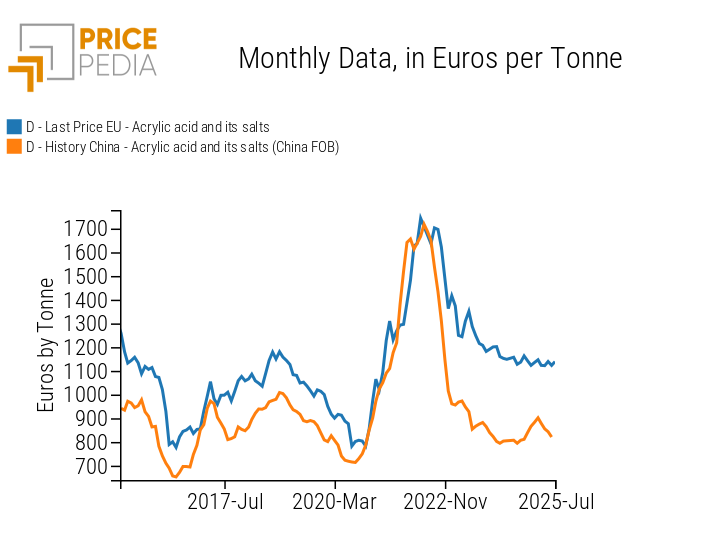
Within this group, two representative cases are sebacic acid and acrylic acid, whose comparison between Chinese and European prices is shown in the charts below.
Comparison between Chinese and European prices (euro/ton)
| Sebacic Acid | Acrylic Acid |
|
|
Up until the pandemic crisis, the European intra-EU trade price of sebacic acid was perfectly aligned with the FOB export price from China. Starting in 2020, however, a differential emerged, with the European price slightly higher than the Chinese one. In the following years, this gap has widened gradually, though at a moderate pace. These market dynamics are fully consistent with China’s undisputed dominance in the international trade of sebacic acid.
The price trend of acrylic acid is very similar, though characterized by a wider gap between European and Chinese prices. This differential, however, did not worsen during 2025 and remains close to the levels observed in 2019. In this case too, China is the world’s leading exporter, followed closely by Belgium and Germany[2].
Group of Prices with a Growing Differential
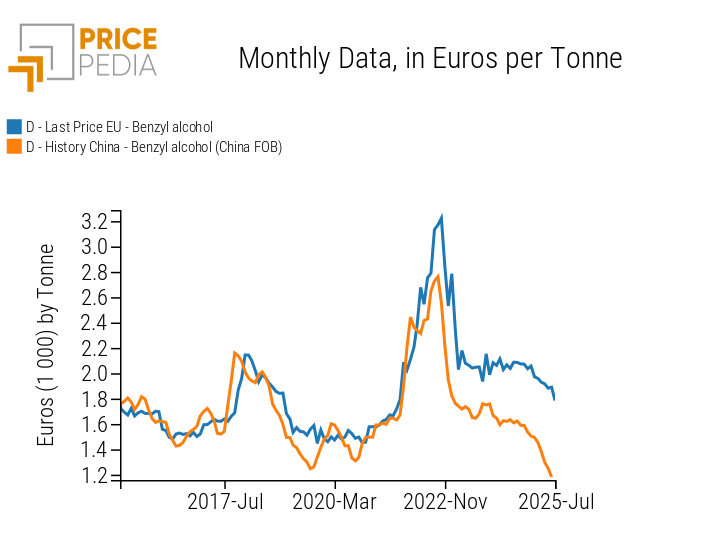
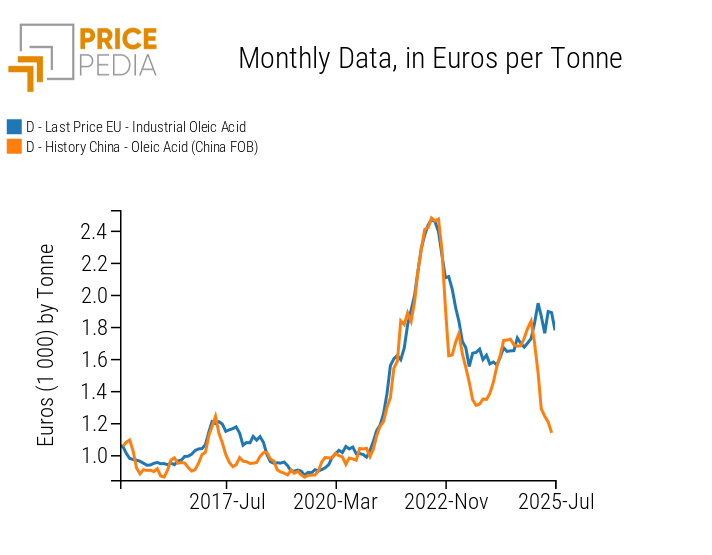
Within the group characterized by a sharp increase in the price gap between European and Chinese markets in 2025, two notable cases are benzyl alcohol and oleic acid. The comparison between their Chinese and European prices is shown in the charts below.
Comparison between Chinese and European prices (euro/ton)
| Benzyl Alcohol | Oleic Acid |
|
|
Until 2021, the European price of benzyl alcohol was essentially identical to the Chinese export price. In the following years, however, a gap emerged, with European prices consistently higher than Chinese ones. This differential widened dramatically during 2025.
The case of oleic acid shows a similar pattern: up to the end of 2025, European prices were largely aligned with Chinese ones, but during this year the two diverged sharply, with European prices remaining relatively stable while Chinese prices collapsed. Unlike the other three cases discussed in this article, China is not among the world’s leading exporters of oleic acid. Global trade in this commodity is dominated by Indonesia and Malaysia, whose export prices likely set the global benchmark. Chinese and European prices, in turn, tend to align with these benchmarks, depending also on the specific conditions of their respective markets.
Summary
In recent years, China has gained leadership in the global trade of organic chemistry commodities. For many products, Chinese FOB export prices have become the global benchmark, with European prices tending to follow their trend.
When Chinese prices undergo a significant decline, international market forces tend to translate this, on average, into a reduction in European prices as well.
However, within the family of organic chemistry commodities, substantial differences remain across individual product markets. These differences suggest caution in generalizing the overall trend to all products, as the average situation does not necessarily reflect the specific dynamics of each case.
[1] The 2025 growth rate is calculated using the average of the first seven months as the annual value.
[2] For an analysis of how China has climbed the global rankings in the acrylic acid and derivatives industry, see the article Growth of Chinese Exports of Acrylates and Methacrylates: Impact on EU Prices.


